Infographic Slides 2017
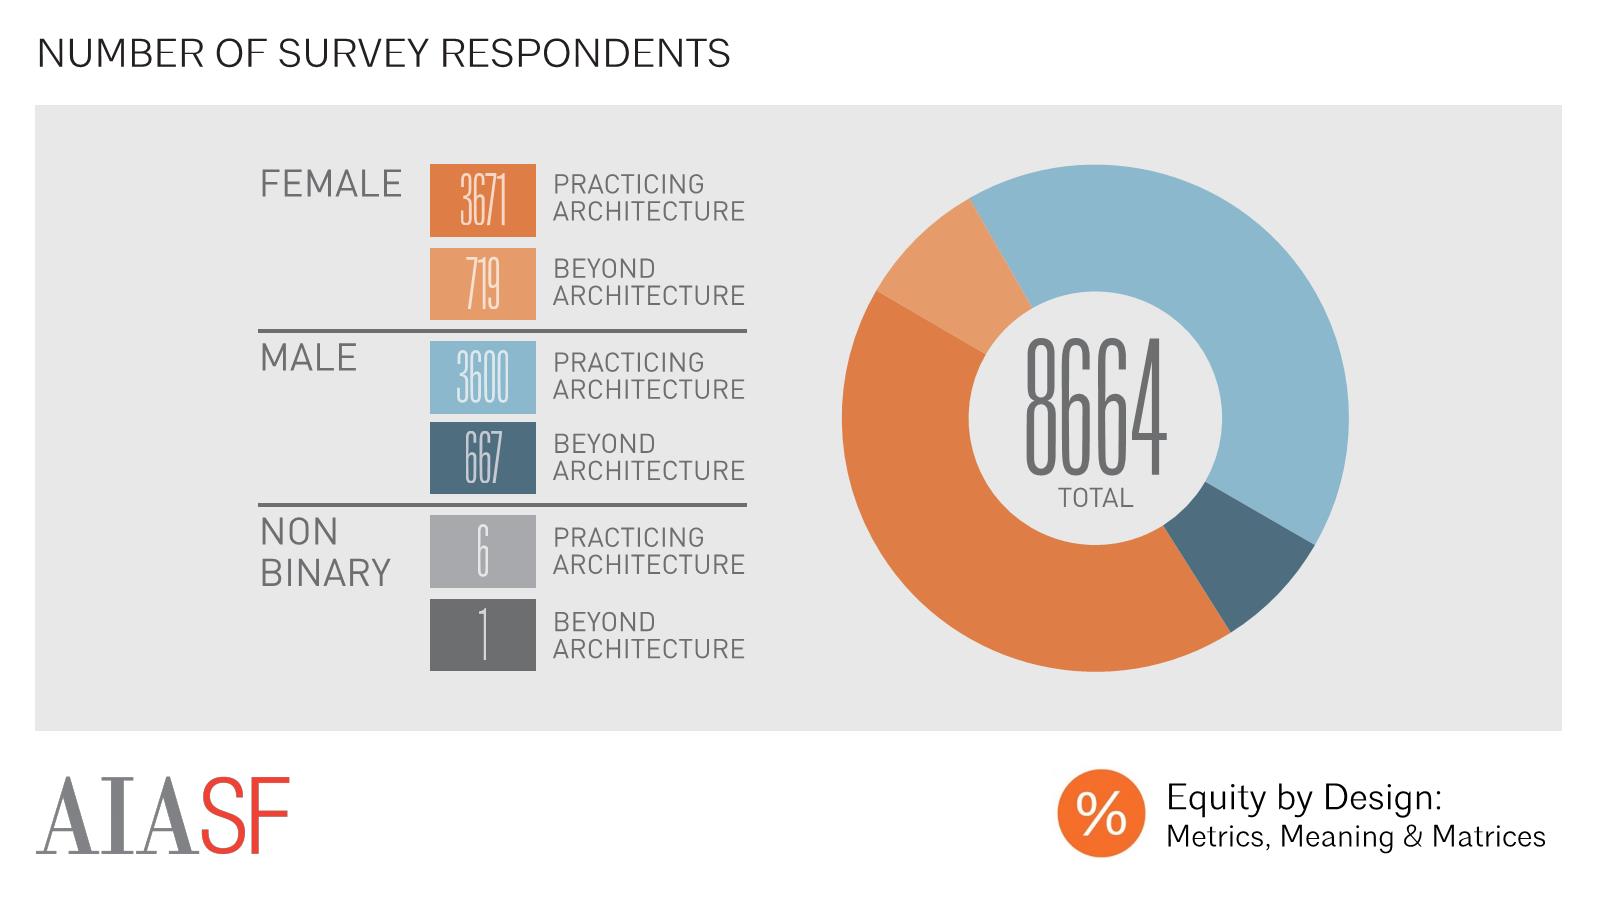
Gender of Survey Respondents
Overall, 8,664 respondents participated in the survey, making this the largest survey ever conducted on the topic of equity in architecture in the U.S. Of our 8,664 survey responses, roughly 50% identified as female, and 50% identified as male. We also had a small number of respondents (<1%) with non-binary genders. The non-binary gender sample was too small to allow us to conduct statistically valid analysis on this group on the basis of gender. We hope to over-sample this population in the future in order to be able to conduct more meaningful analysis on this group’s experiences. By comparing this to data from the AIA Firms Survey Report, we can see that the 2016 Equity in Architecture Survey over-samples women, who make up only 31% of architectural staff in AIA member-owned firms.
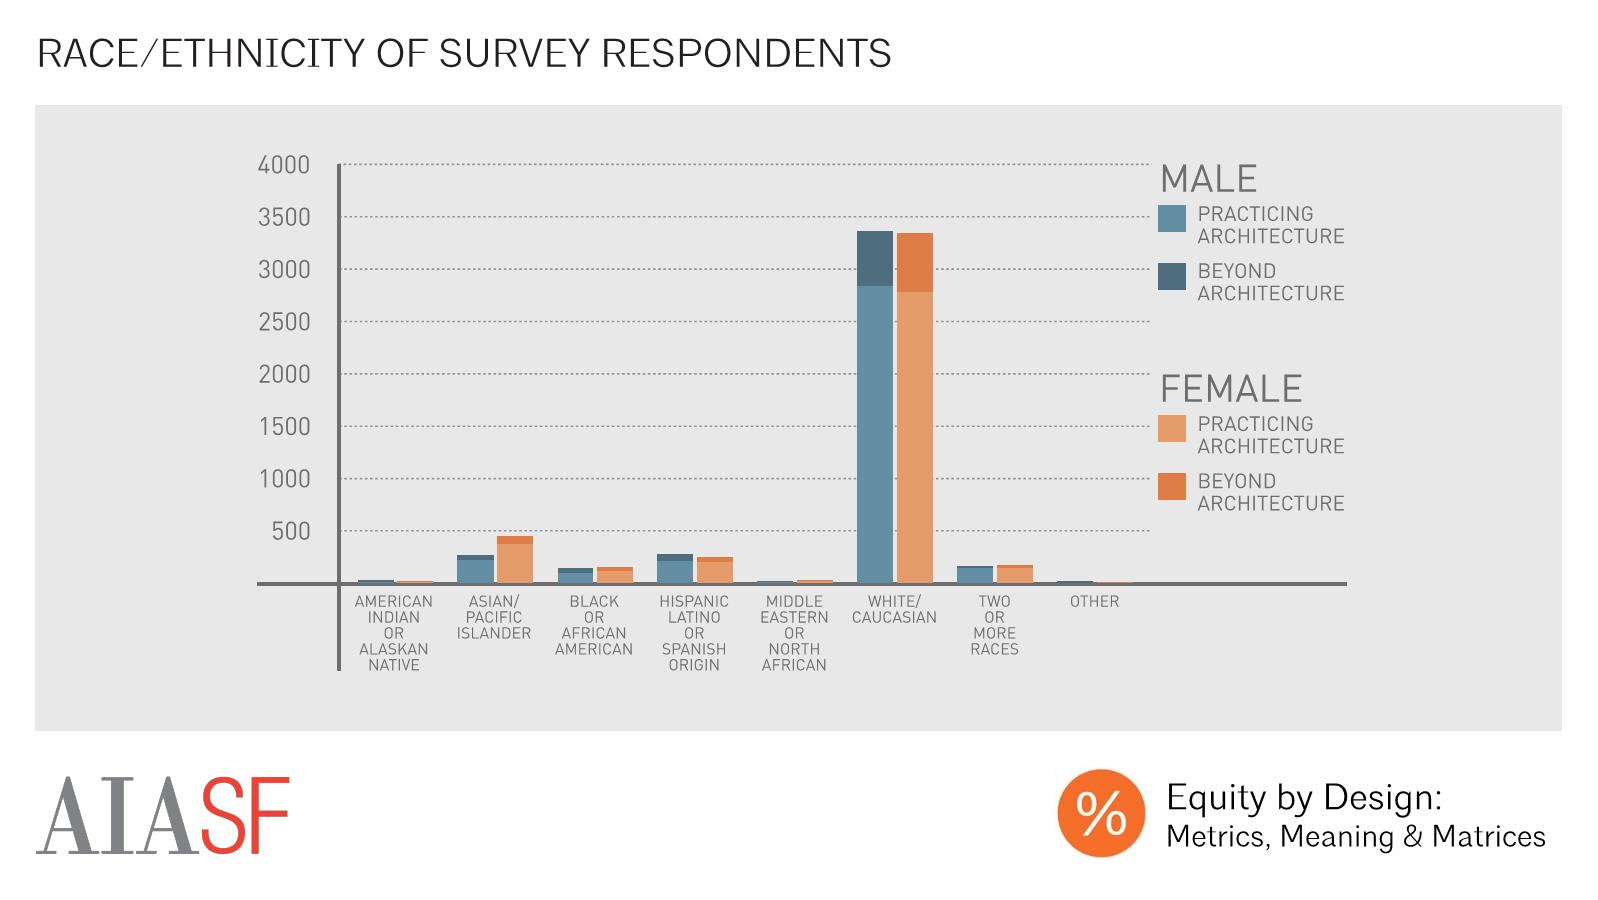
Race/Ethnicity of Survey Respondents
While we had a relatively even gender representation in our respondent pool, there was little racial or ethnic diversity, with 78% of respondents describing themselves as “white or caucasian.” According to the 2016 AIA Firm Survey Report, approximately 21% of the architectural staff working in AIA member-owned firms are people of color, suggesting the the 2016 Equity in Architecture Survey sample is fairly representative of the racial and ethnic diversity of AIA member-owned architectural firms. While the sample was representative as a percentage of the field, this also meant that it was quite small compared to the sample of the white population. This sample size, coupled with high degrees of response variability within this population, made drawing statistically valid conclusions on the basis of individual racial or ethnic group impossible for most questions due to insufficient sample size. In future rounds of study, we hope to gather more responses from people of color in order to be able to better understand equity issues as they relate to individual racial and ethnic groups.
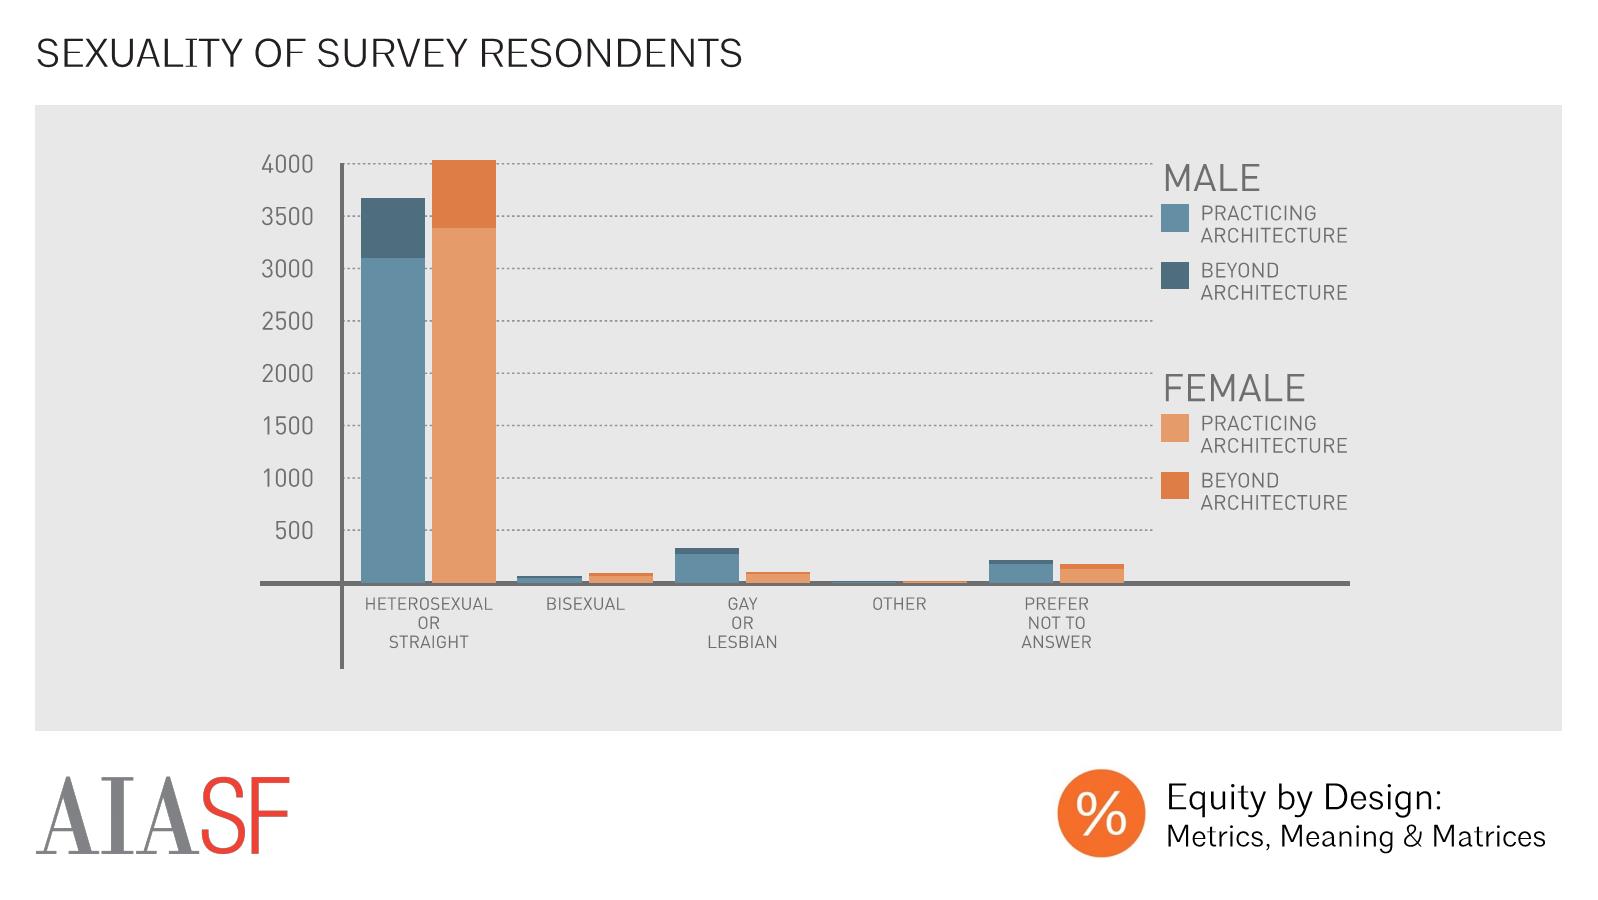
Sexuality of Survey Respondents
The survey population also had little diversity in terms of sexual orientation, with 86% of male respondents, and 92% of female respondents, identifying as straight, or heterosexual. The datasets that we typically use to understand the demographics of the profession -- including those from NAAB, NCARB, and the AIA -- don’t include statistics on the sexual orientations of architectural practitioners, so we can’t make any conclusions about how our sample compares to the architectural community on this issue.
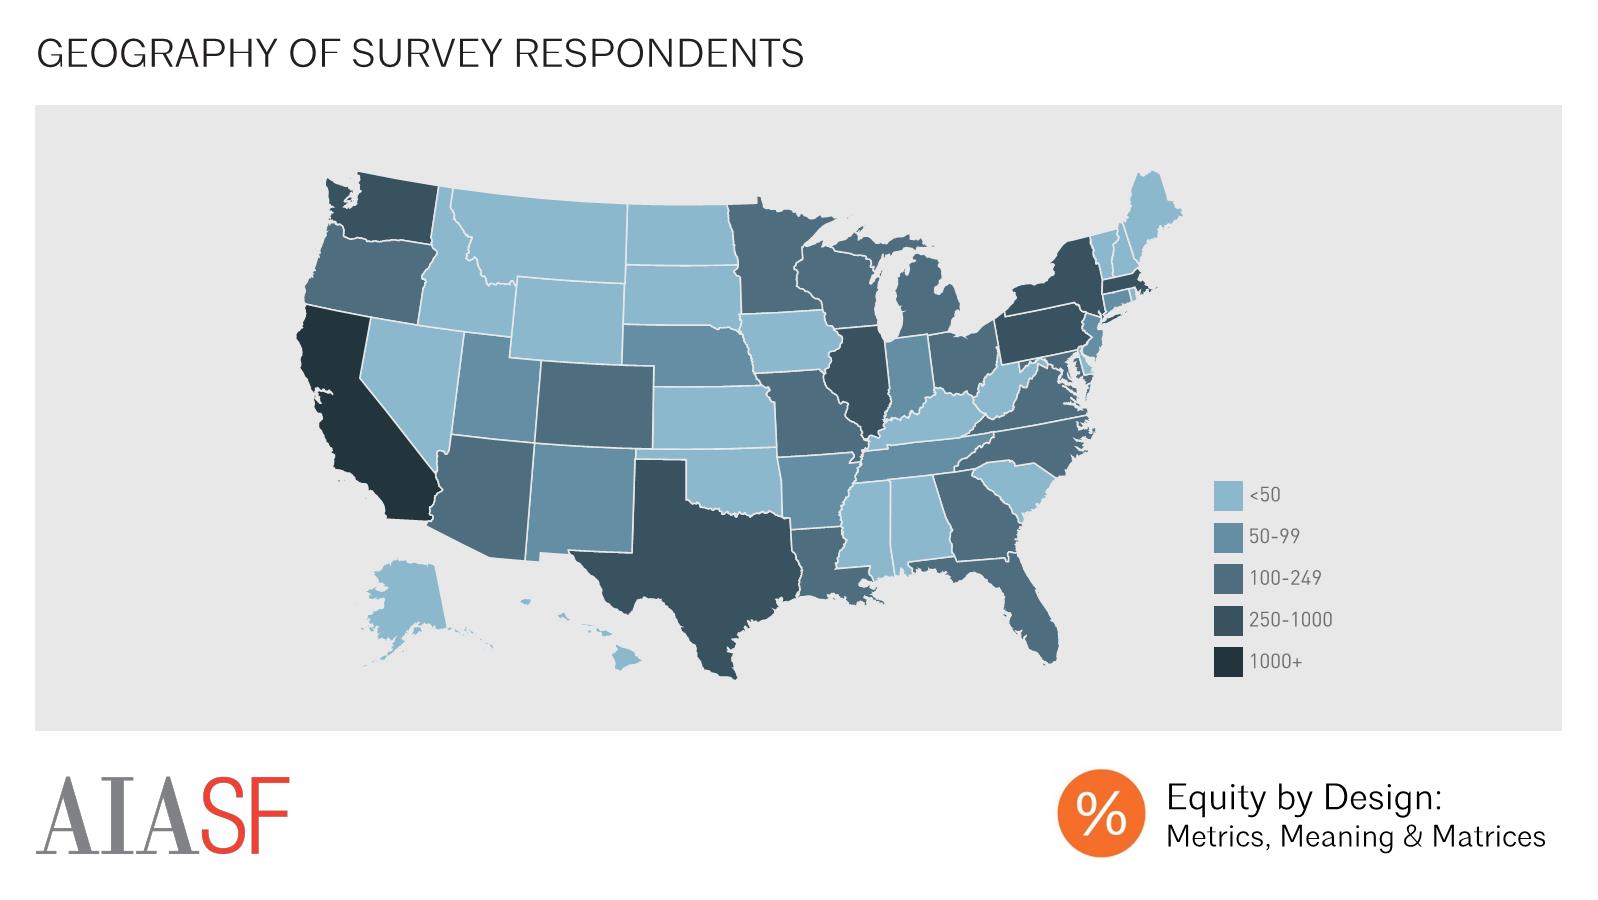
Geography of Survey Respondents
Our respondents’ geographic location was also fairly representative of the distribution of architectural professionals in the country, with heavy concentrations of respondents in states like California, New York, and Illinois. Overall, we received survey responses from all 50 states, as well as from foreign countries on six continents.
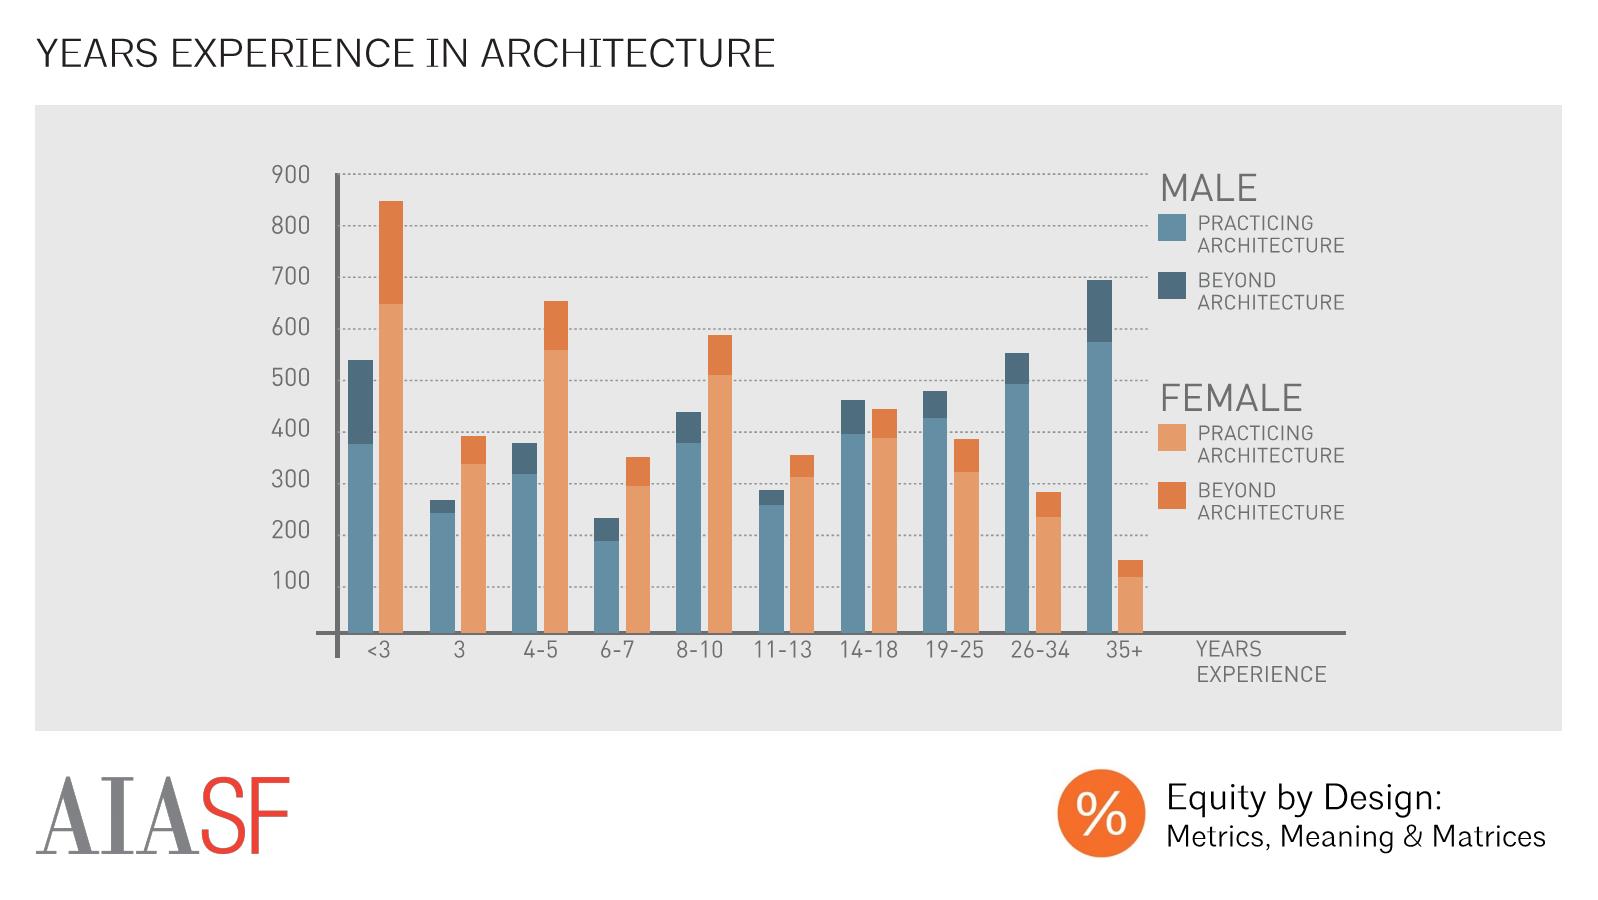
Years Experience in Architecture
There was an interesting pattern in the experience level of our respondents. While the majority of our less experienced respondents were female, the majority of our respondents with more than 14 years of experience were male. In some ways, this is representative of what’s been called the “pipeline problem” in architecture. For instance, men were much more likely than women to have graduated from architecture programs 25 years ago, and so it makes sense that there are many more men than women with 25 years of experience today. For practical purposes, though, this means that it’s very hard to simply compare men to women in our results without also introducing confounding age and experience-level-related distinctions. That’s part of why you’ll see that we often analyze variables like salary by both gender and years of experience.
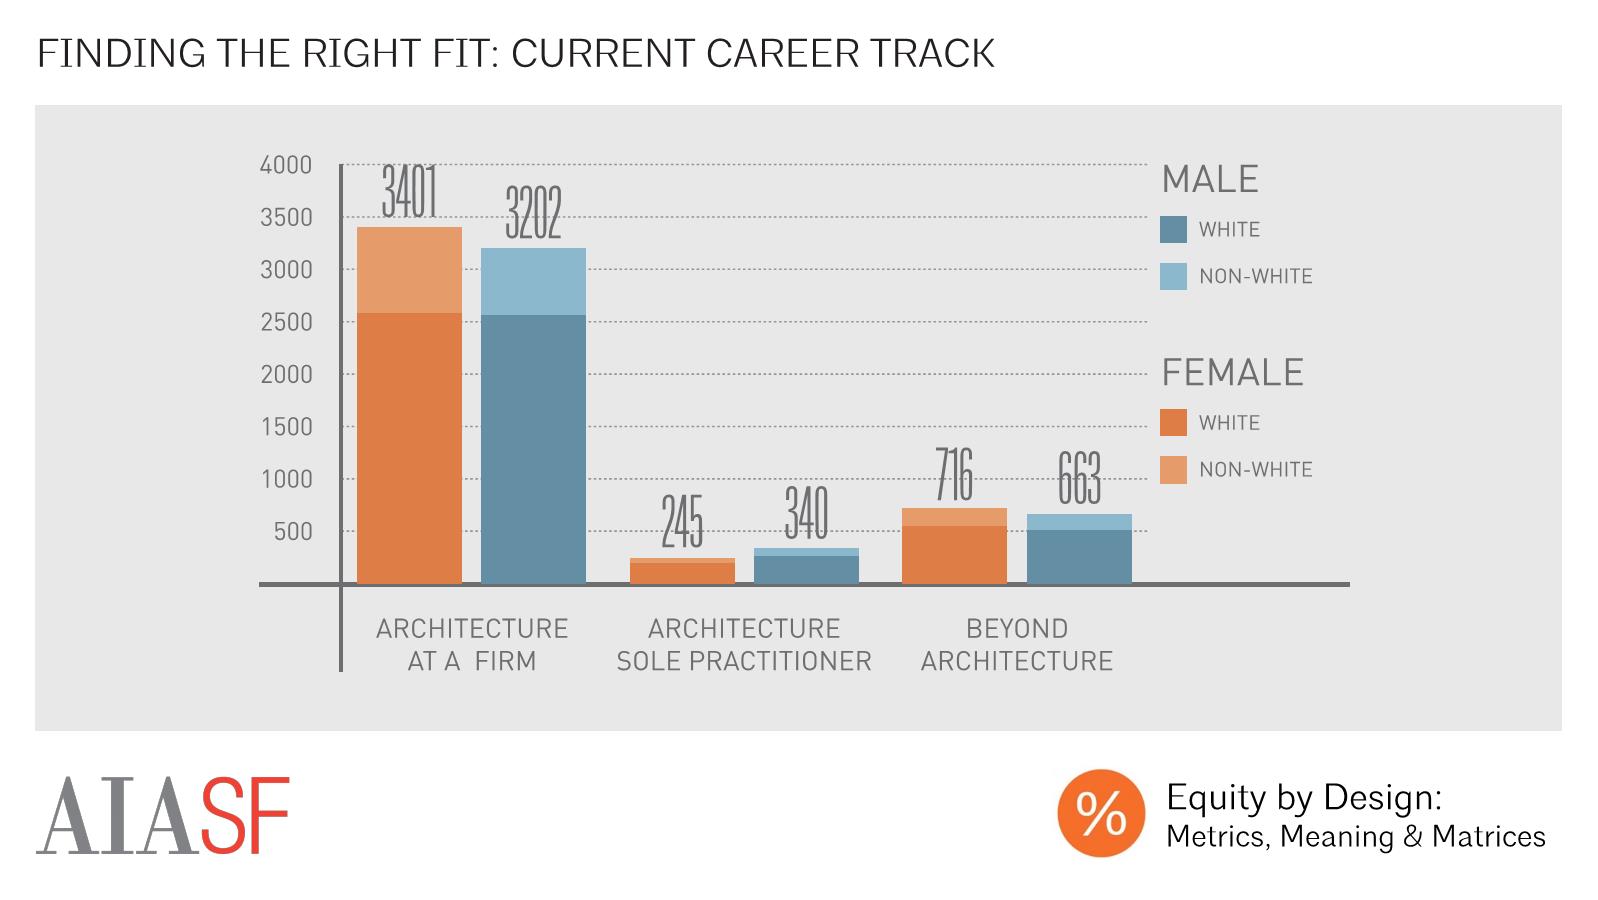
Current Career Track
Because our study sampled architecture school graduates, not all respondents were currently working in architecture firms. The majority - 84% of all respondents - were currently practicing architecture, either within a firm or as a sole practitioner. There weren’t significant differences in respondents’ likelihood of practicing architecture on the basis of either race or gender. There were, however, differences in work setting amongst those who practiced architecture. For those practicing architecture, a firm was the most common work setting. This was especially true for women of color, who were only half as likely (4%) as either white men (8%) or men of color (8%) to work as a sole practitioner. In addition to those who were currently working in a firm or as a sole practitioner, we had a significant number of respondents who weren’t working in one of these settings, and may have been working in a related field or in another industry, providing full-time care for a family member, studying, unemployed, or retired. We have used the label "beyond architecture" throughout our analysis to identify this diverse population.


Top Reasons for Accepting Job
We found that the top three reasons that respondents accepted jobs were “quality of projects”, “learning opportunities”, and “firm reputation.”

Top Reasons for Accepting job by Gender and Race
Respondents tended to cite similar reasons for taking jobs, although women were slightly more likely to prioritize work-life flexibility, while men, and especially men of color, were slightly more likely to prioritize advancement opportunities. Respondents of color were more likely than white respondents to cite salary offered as a primary motivator in choosing their job.
White male respondents were the least likely of any group to report taking a position based on “learning opportunities.” This difference, however, is largely explained by the difference in median experience level between white male and other respondents, as those starting their careers were more likely to report taking their jobs to capitalize on learning opportunities.

Firm Size by Gender
Respondents reported working in firms ranging in size from sole proprietorships to large firms with over 1000 employees. The plurality of respondents worked in firms with fewer than 20 employees. Female respondents were more likely to report working in firms with fewer than 20 employees, while male respondents were more likely to report working in the largest firms.
Respondents’ firm size was strongly correlated with their top reasons for taking their current jobs, with those in the smallest firms most likely to say that they had taken their jobs because they afforded work-life flexibility and because they shared values with their firms. Those working in the largest firms, meanwhile, were significantly more likely than those working in small firms to report that they had taken their position because of their firm’s reputation, project quality, salary offered, and advancement opportunities. These patterns are mirrored in the lived experiences of employees, with those working in the smallest firms reporting the highest average satisfaction with their work-life flexibility. Meanwhile, average salaries were largest within the largest firms and those working in the largest firms tended to have the most positive impressions of their firms’ promotion processes.

Firm Size by Race/Ethnicity
There were also significant differences in firm size on the basis of race, with white, latinx, and multi-racial respondents most likely to work in firms with fewer than 20 employees. African American or Black respondents were slightly more likely to work in small and medium-sized firms, but had a similar overall distribution of firm sizes. Asian respondents, meanwhile, were most likely to work in medium firms, with 50-249 employees, and were also more likely than others to work in large and extra-large firms.

Metrics of Success
On average, male respondents’ career perceptions were more positive than those of their female counterparts. When asked about the relative positivity or negativity of their career perceptions across 14 categories from “work –life flexibility” to “promotion process ”to their likelihood of staying at their job for the next year,” male respondents’ average perceptions were more positive than female respondents’ in every category. The largest gender gaps indicated significant differences between men’s and women’s likelihood of feeling energized by their work (male respondents 7% more likely), likelihood of “having a seat at the table”, or being included in one’s firm’s decision-making process (male respondents 6% more likely), and likelihood of planning to stay in one’s current job for the next year (male respondents 6% more likely).
There were also areas of work-life that tended to be viewed more positively or negatively by all respondents: average perceptions of autonomy, satisfaction, and confidence tended to be most positive for respondents, while respondents’ average perceptions of their firms’ promotion processes, their work-life flexibility, and their workloads were least positive, on average. Male respondents perceptions were more positive, on average, than female respondents’ perceptions in each of these categories. We did not observe significant differences in career perceptions on the basis of race or ethnicity.
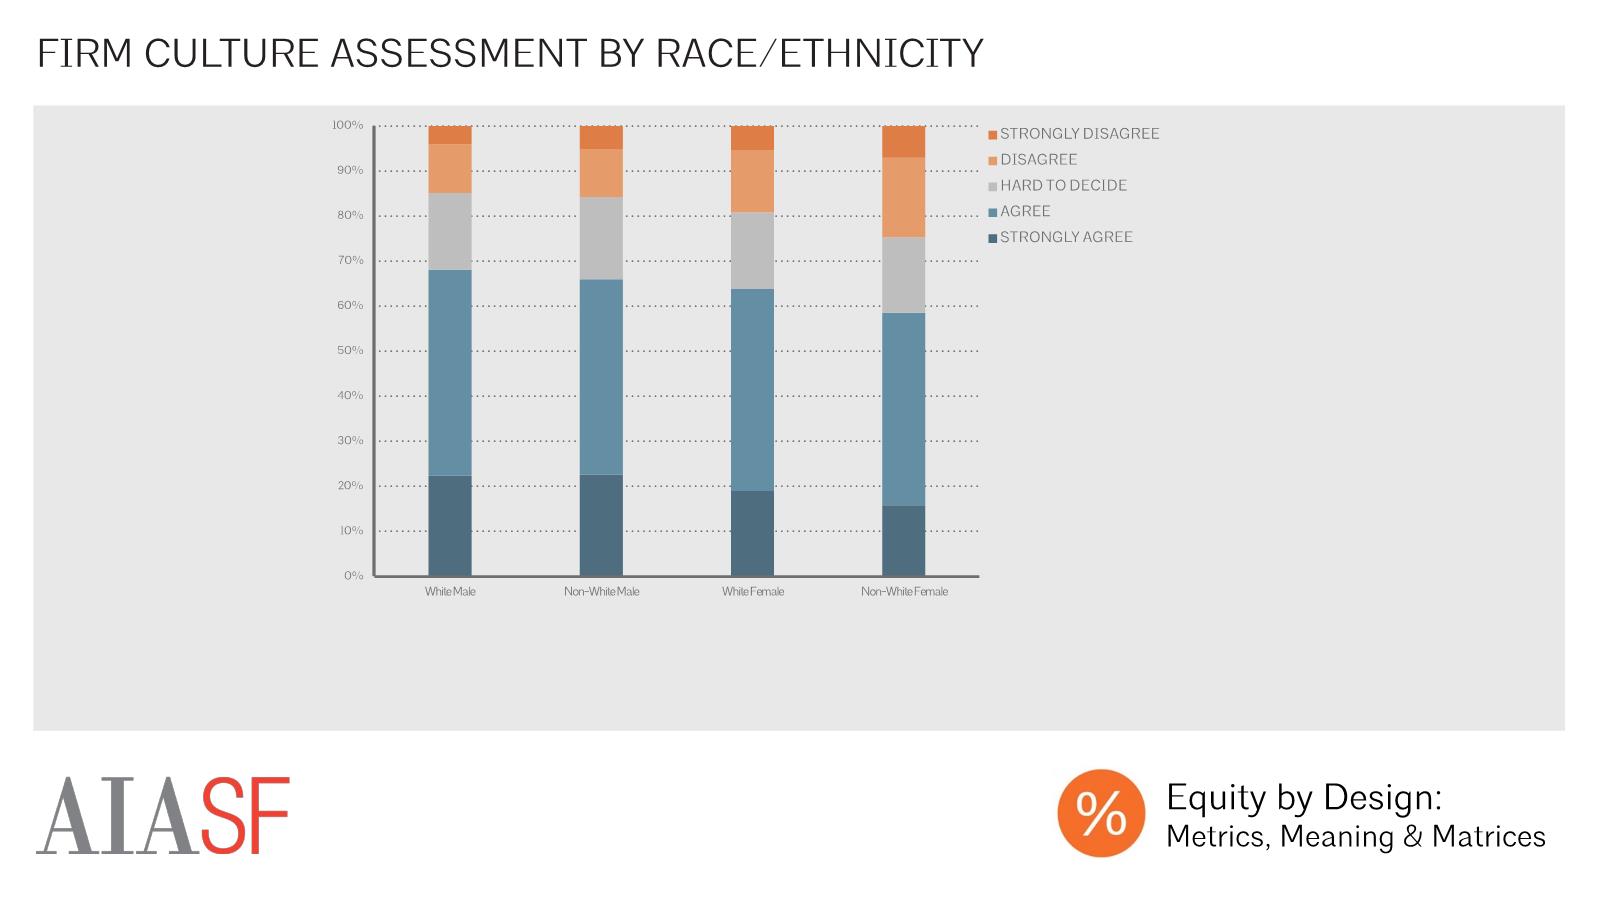
There were also significant differences in career perceptions in several areas on the basis of race as well as gender. White men were most likely to agree with the statement “I am satisfied with my workplace culture,” with men of color, white women, and women of color each successively less likely to agree with this statement.
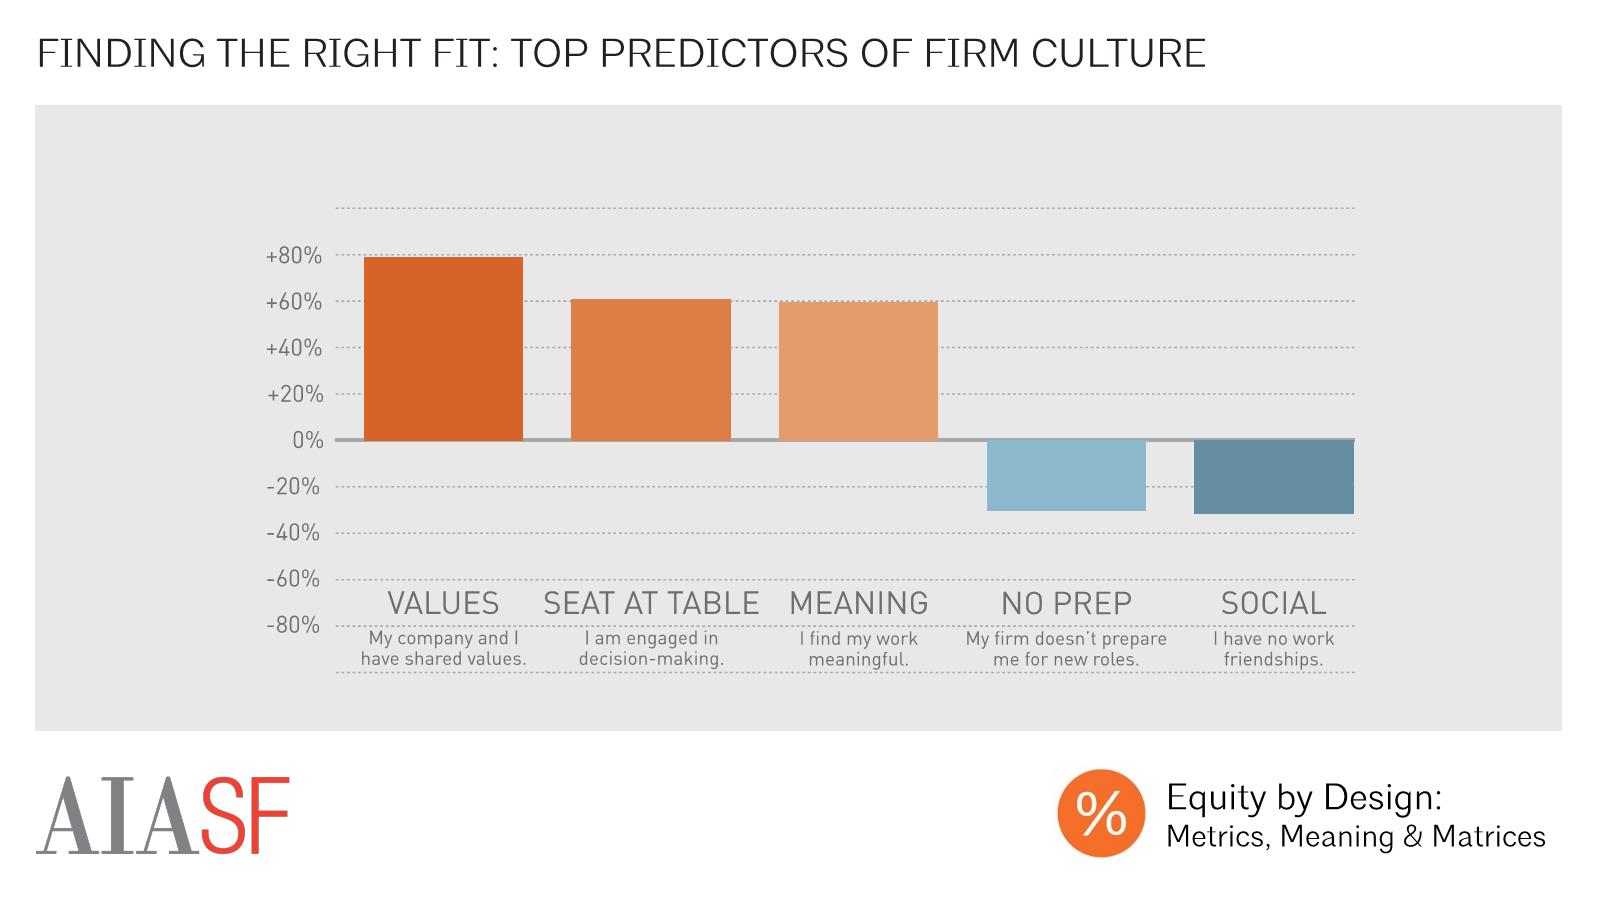
While workplace culture was viewed more negatively on average, by female respondents and by respondents of color, neither gender nor race were top predictors of whether a respondent had a positive assessment of their culture. Instead, the beliefs that a respondent shared values with their employer, that they were engaged in the decision-making process, and that they found their work meaningful and rewarding were associated with positive assessments of firm culture. Female and non-white respondents were less likely than white male respondents to agree with each of these statements. This suggests that equity issues are often multi-faceted, and that organizations must address equity holistically by looking beyond issues of representation to address issues of access, relationships, and culture.

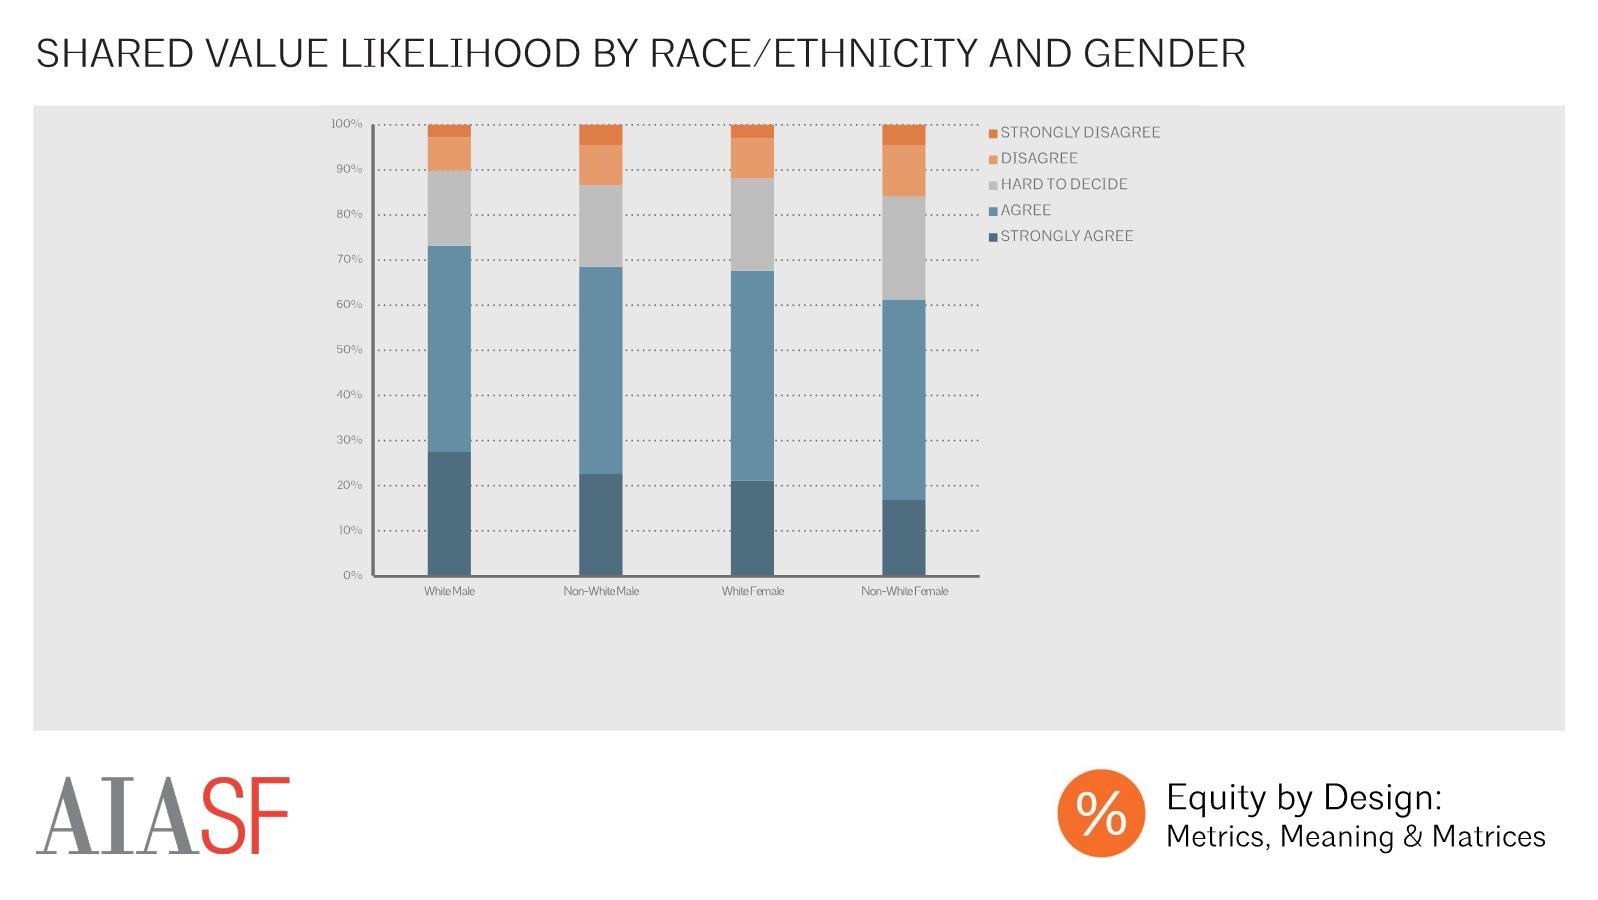
The top predictor of whether or not a respondent was satisfied with their workplace culture was the degree to which they agreed or disagreed with the statement “My values and my company's values are alike.” According to a study conducted by Michael Leiter and Christina Maslach, sharing values with one’s company also tends to be the greatest overall predictor of job-person fit, and whether an individual will stay with their current company and be engaged in their work. It’s unfortunate, then, that white male respondents were significantly more likely than others to report that they shared their companies’ values, with women of color least likely to agree with this statement.

Sharing values with one’s employer, meanwhile, was strongly correlated with a range of factors, with those who believed their day-to-day work was relevant to long term goals, those who received ongoing feedback about their work, those who received one-on-one coaching in preparation for new roles and responsibilities, and those who said that use of work-life benefits didn’t affect promotion within their firms most likely to agree that they shared values with their firm. Meanwhile, those who received no training, those without workplace friendships, and those who didn’t know their firm’s performance evaluation criteria were least likely to share values with their company. In short, those with strong, personalized relationships with peers and firm leadership were most likely to see an alignment of values.

Workplace relationships were one of the greatest predictors of workplace culture assessment, with respondents who said that they didn’t have any relationships at work reporting 30% more negative perceptions of their firm culture than those who had workplace friendships. Fortunately, the vast majority of respondents reporting having social relationships at work, with over 70% reporting that they ate lunch or took breaks with coworkers, just over half of respondents reporting that they socialized with coworkers outside of work, and nearly half of respondents reporting that they had close friendships at work. There were slight differences in reported workplace relationships, with women of color least likely to report socializing with coworkers outside of work, and significantly less likely than white women, but slightly more likely than men, to report having close workplace friendships.

Finally, a range of workplace culture initiatives were related to respondents’ perceptions of workplace culture, with respondents reporting that the most effective ways that their firms could promote workplace culture were by organizing social events, by providing space for taking breaks and eating lunch, and by sharing company goals and achievements with employees.

As Maslach and Leiter have shown, these firm culture initiatives and other efforts to keep employees engaged and happy are ultimately important because they impact employee retention. On average, respondents had been with their current firms for 6.8 years. This mean is significantly above the median tenure of three years with a firm, in part because 20% of respondents had been with their firms for 11 years or longer, which pushed the mean higher. Average tenure increased with experience level, with average tenure equalling about half of total years of experience in the field at most experience levels.

When asked why they had left their last jobs in the field, respondents cited “better opportunities elsewhere”, a “lack of advancement opportunities”, and “low pay” most frequently.

While average tenure with one’s current firm was relatively high, we also found that a large number of respondents were considering leaving their current jobs. Overall, we approximately 1 out of 4 respondents reported that they were either somewhat or very likely to leave their firms within the next year.
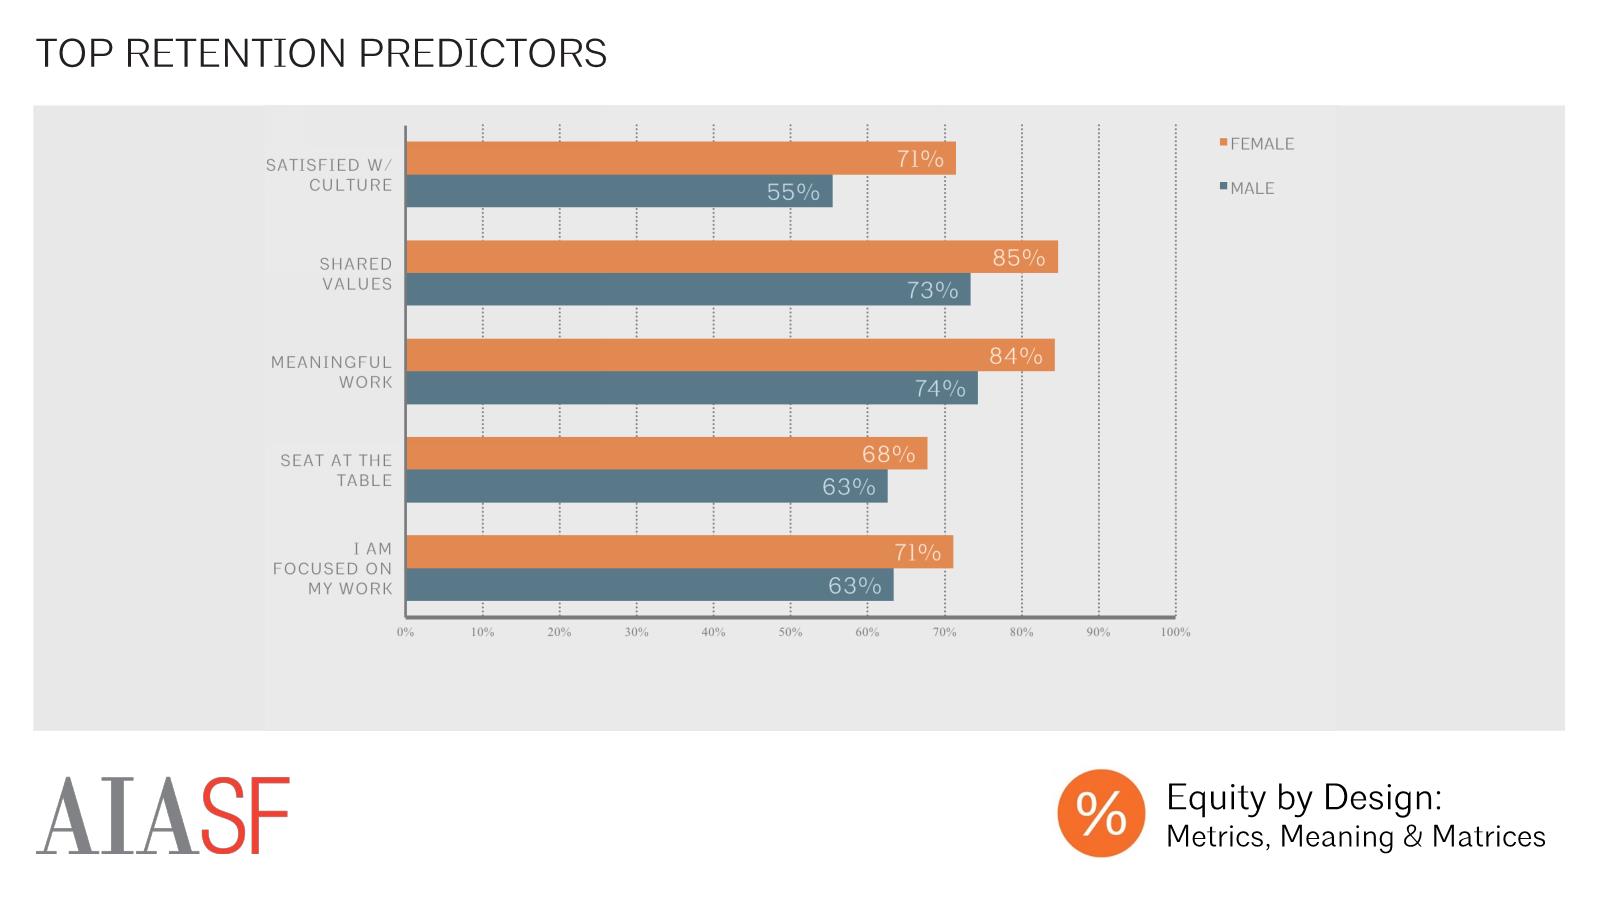
Several factors were strongly correlated with a respondent’s likelihood of planning to remain in their current position, with those who believed that their work was meaningful and rewarding, those who shared values with their company, those who reported feeling involved in their work, those who were given a seat at the table by being included in their firm’s decision-making process, and those who were satisfied with their workplace culture most likely to plan to stay in their current position.
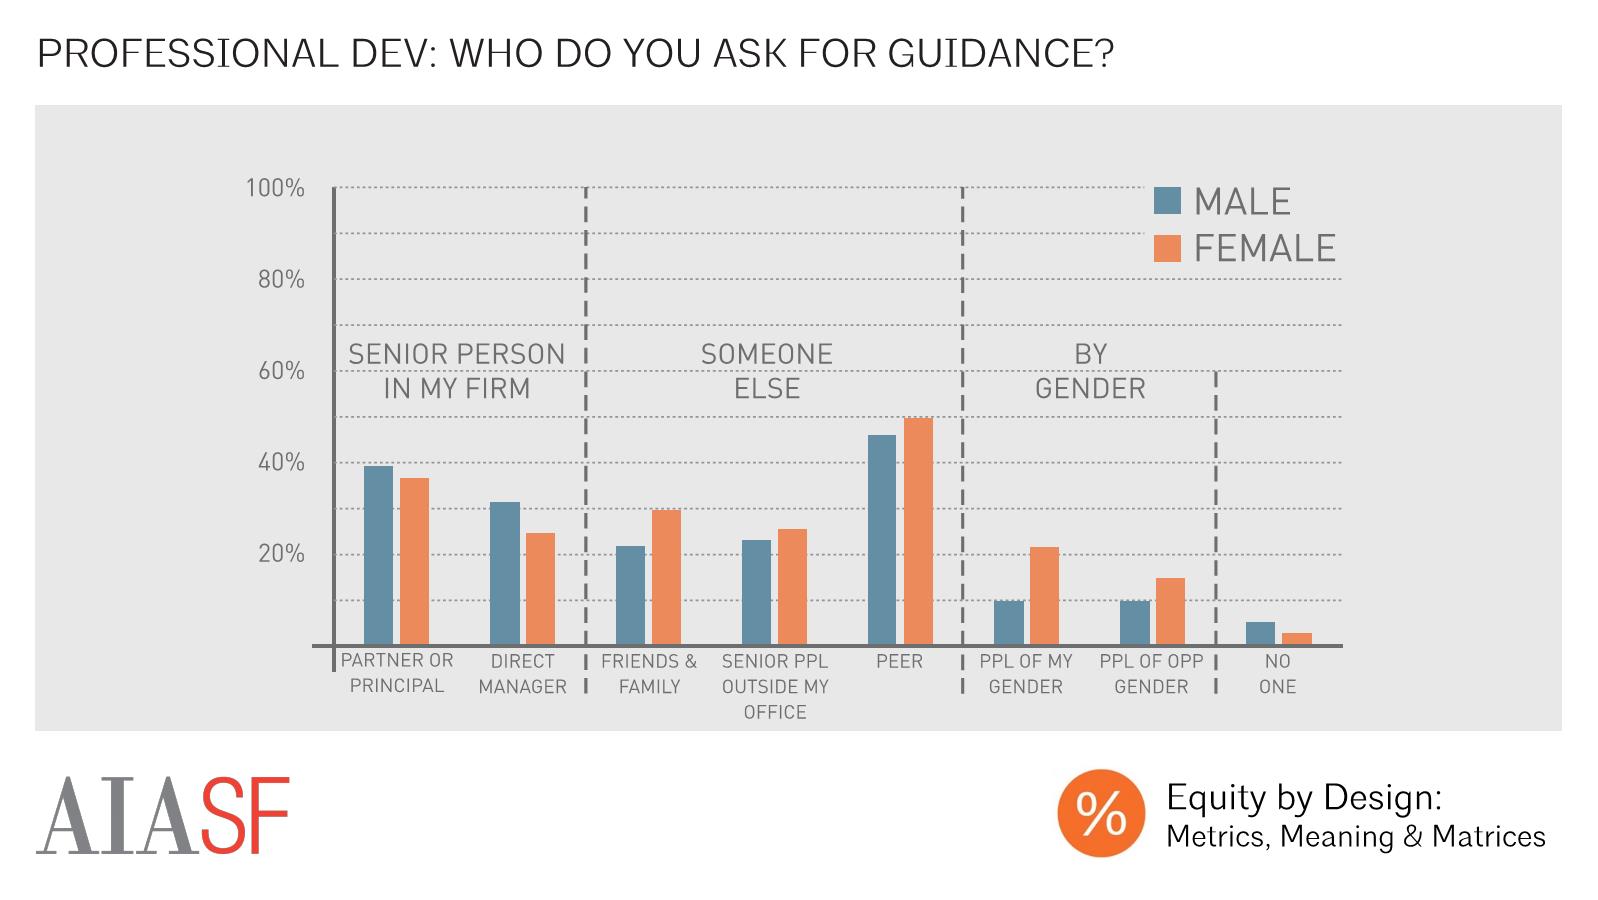
Who Do You Ask for Professional Guidance?
Mentorship and sponsorship -- and especially having access to career advice from a senior leader in one’s own firm -- emerged as important predictors of career success in the 2016 Equity in Architecture Survey. We found that male respondents were more likely than female respondents to report turning to someone senior within their own office for career guidance.. Meanwhile, female respondents were more likely than their male counterparts to turn to senior leaders outside of their offices, family & friends, and their peers for guidance. They were also more likely to consider gender as a factor when describing their mentors.
Career Perceptions: Received Guidance from Senior Leader
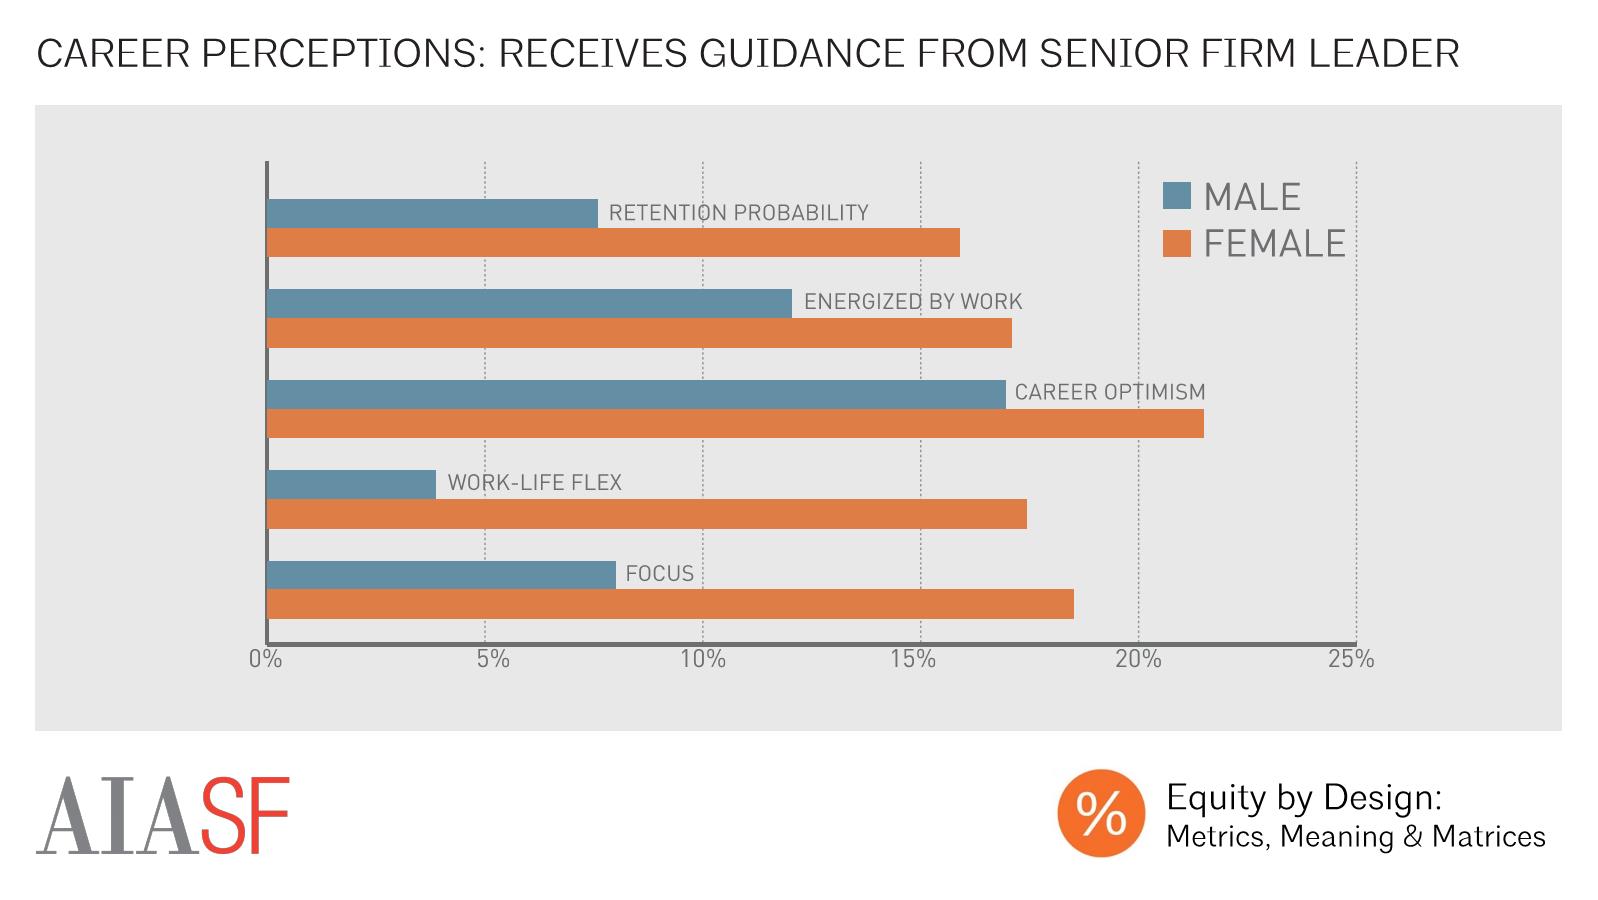
Male respondents’ increased likelihood of turning to senior leaders is especially significant because, compared to those who received no career guidance, those who turned to a senior leader within their firm were more more optimistic about their professional futures, more energized by their work, more likely to plan to stay at their current job. These correlations were stronger for female than for male respondents, suggesting that female respondents have more to gain by finding a senior mentor from their own firm.

Overall Pay Gap
White male respondents made more annually, on average, than white women or people of color. While white men made $96,514, on average, non-white women earned $69,550 on average. It’s important to note, however, that a large part of this difference in annual earnings can be attributed to discrepancies in the average experience level of demographic groups within the survey sample – while the average white male respondent had 18.5 years of experience, the average non-white female averaged 9.0 years, for instance.

Average Salary by Gender and Years Experience
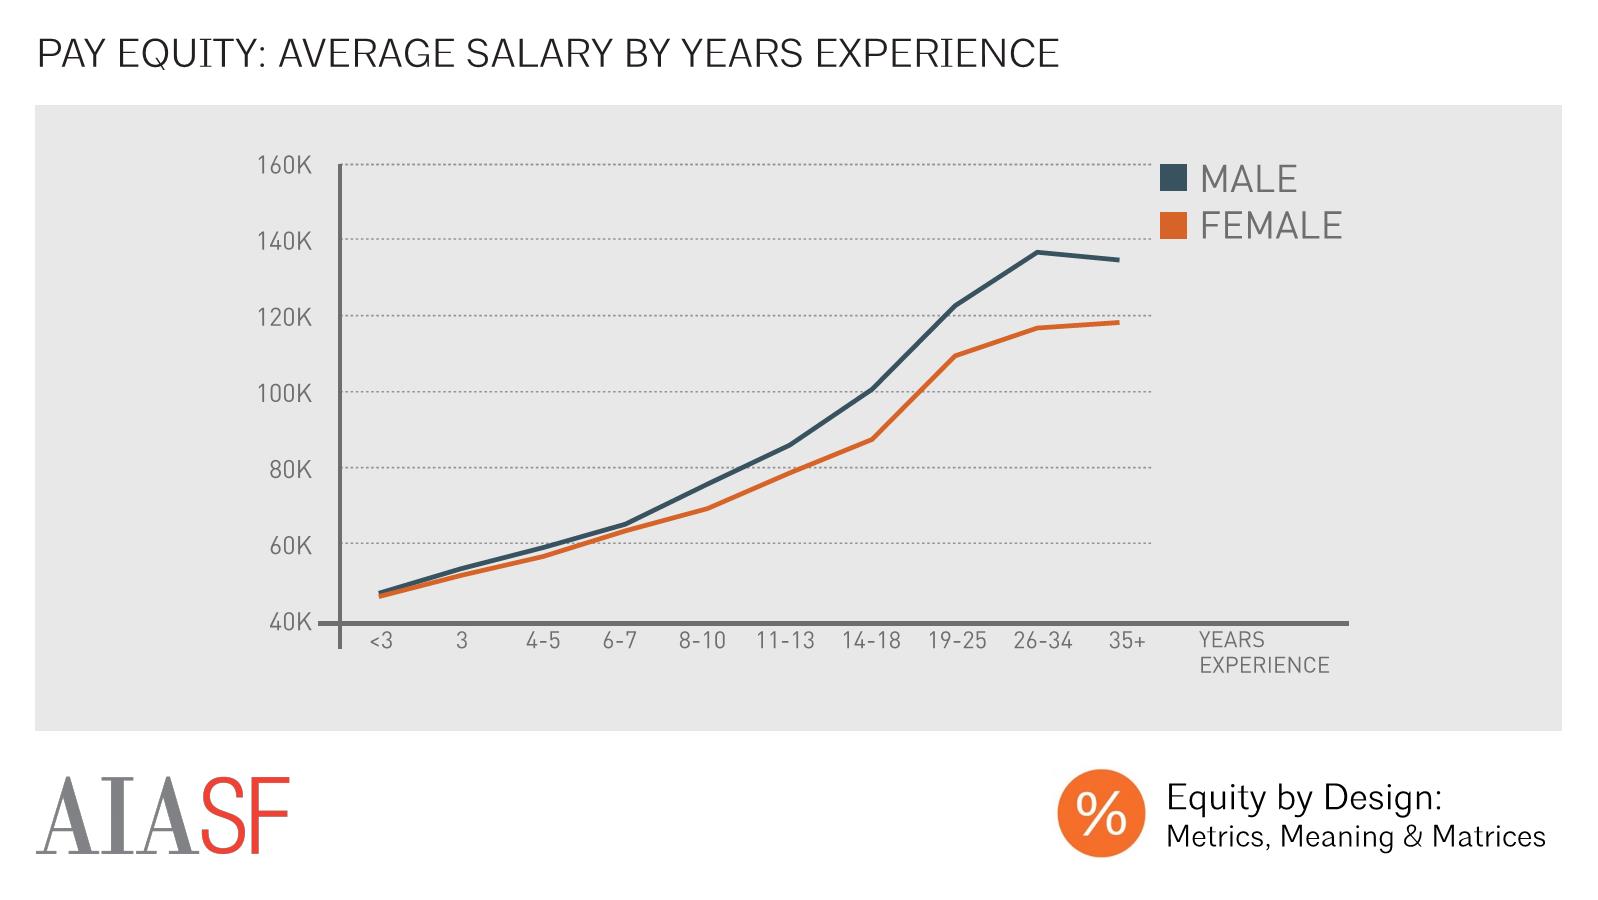
While the difference in respondents’ average levels of experience accounts for some of the wage gap, significant differences in pay were observed between white male and other respondents even after controlling for years of experience. At every level of experience, male respondents made more, on average, than female respondents, with the largest differences amongst those with the most experience in the field.

Average Salary by Race/Ethnicity and Years Experience
There were also differences in annual earnings on the basis of race, with Black or African American practitioners with 14 or more years of experience earning less, on average, than White, Asian, Hispanic, or multiracial respondents. There were not significant differences in average annual earnings when comparing white and non-white respondents more generally.

How do You Define Success in your Career?
This wage gap is important because earnings played a significant role in the way that respondents evaluated their professional success. “Earnings” were the most commonly cited component of career success, with 42% of females, and 44% of males, stating that they used earnings to define success in their careers.

Practicing Architecture: Top Reasons for Leaving Last Job
Earnings were also tied to decisions about whether respondents stayed at a firm. Amongst those still practicing architecture, “low pay” was the third most commonly cited reason for having left one’s previous employer, after “better opportunity elsewhere” and “lack of opportunities for advancement.” Female respondents were more likely than male respondents to report leaving a position due to low pay.

Beyond Arch: Top Reasons for Leaving Last Job
Amongst those who had left architecture for careers in other fields, earnings were an even more important factor, with “low pay” as the second most commonly cited reason for leaving. The most common reason was “better opportunity elsewhere”. Again, female respondents were more likely than male respondents to report leaving a position in architecture due to low pay.

Average Salary by Career Path and Grad Year
Even though women in the “beyond architecture” population were more likely to leave a position in architecture due to low pay, those who left an architectural firm for a career in another field made less on average than female full-time architectural practitioners within their graduation cohort. Men in the “beyond architecture” population, on the other hand, made more than full-time practitioners at most points in their careers. Simply put, the gender-based wage gap is larger for those who have been trained as architects, but no longer work in an architectural firm, than it is for those working in firms or as sole practitioners.
Part of this large gap in the “beyond architecture” population may be due to the different industries that men and women enter after leaving an architecture firm. While men were more likely to enter high paying fields like construction and real estate development, women were more likely to take positions in education, and the public sector.

Average Salary by Years Experience - Faculty vs. Practitioners
The most common occupation for both men and women in the “beyond architecture” population was architectural education. Within this field, there was a significant, but narrower, par gap, with male architectural educators out-earning women at every level of experience.
Average Salary by Years Experience
The next career dynamic, pay equity, documents the wage gap between our male and female respondents. At every level of experience, our male respondents made more, on average, than our female respondents, with the highest differences at the top of the experience spectrum.
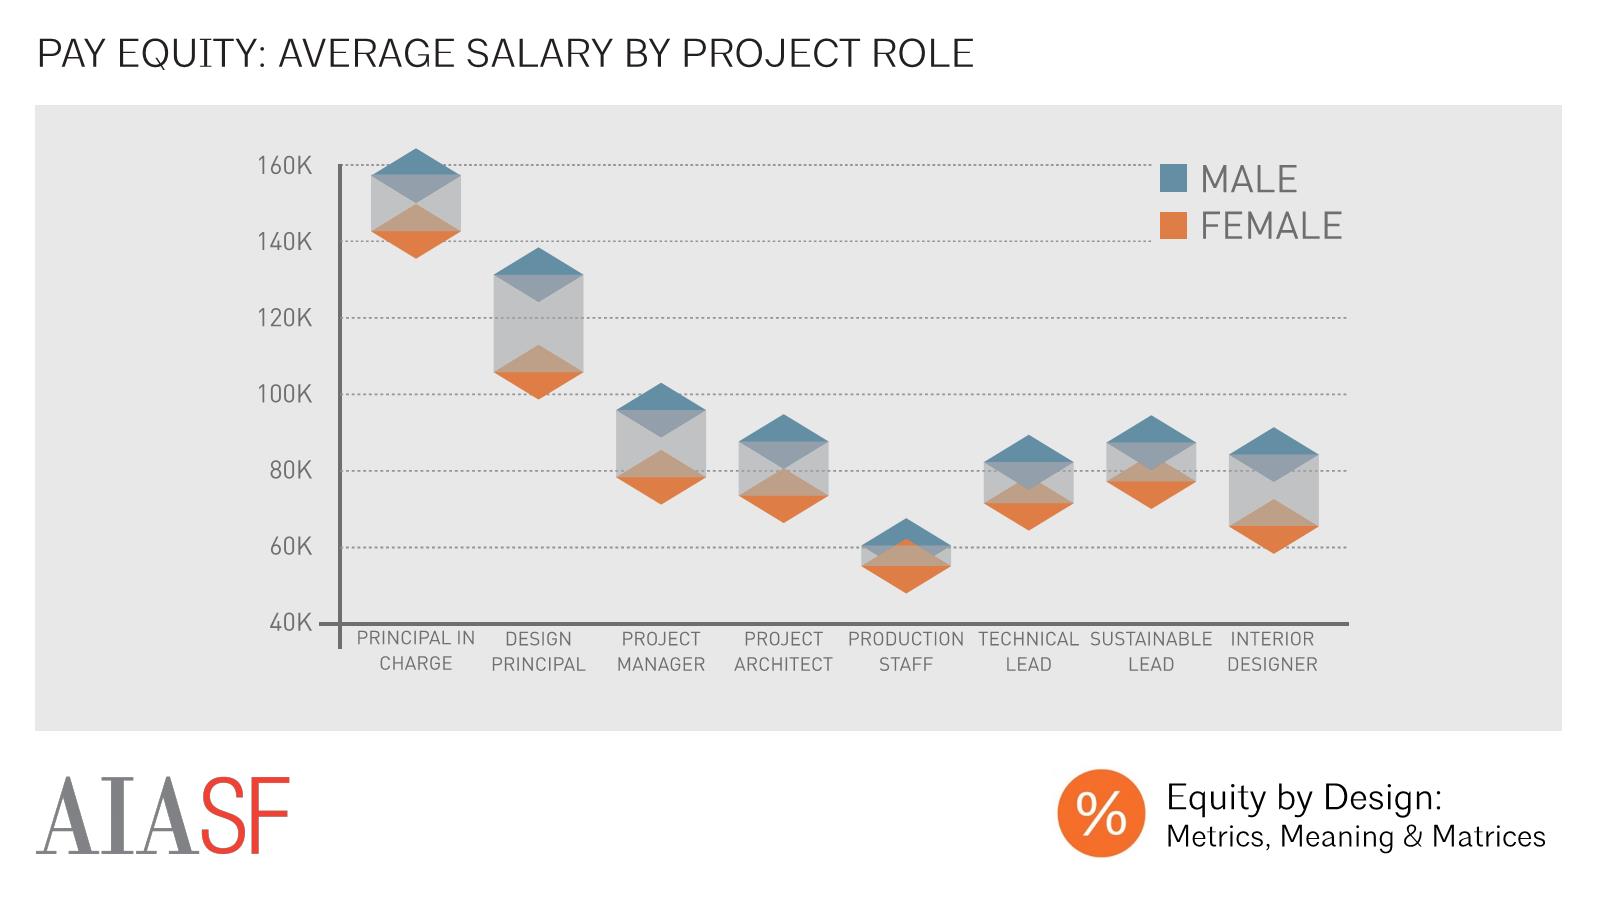
One of the most important ways of looking at the wage gap is to assess whether respondents are receiving equal pay for equal work. Our data showed a gender-based wage gap for every project role, with the largest gap between male and female design principals.


Key Wage Predictors
Several characteristics of one’s job were strongly correlated with either elevated or depressed annual earnings. After adjusting earnings to account for differences in average levels in experience across populations, we found that the strongest predictors of in-sector differences in earnings were related to work setting, and to professional title. Principals and partners made approximately $34,000 more annually than non-licensed designers with comparable experience levels, while titled leaders other than principals or partners made approximately $11,000 more, and licensed architects made approximately $6,000 more. These factors contribute to the wage gap in architecture because female respondents at every level of experience were less likely to hold titled leadership positions within their firms.
Meanwhile, those working in the smallest firms and offices made less money, on average, than those working within larger organizations. Again, because female respondents were more likely than male respondents to work in firms with 20 or fewer employees, the reduced earnings amongst those who worked in these settings contributed to the overall pay gap.

Professional Experience
The single best predictor of earnings was the number of years of experience that one had in the profession, with each year of experience worth approximately $2700 in earnings. There was, however, a great deal of variation in average earnings amongst those with equivalent experience, with the highest degree of variability amongst those with the most experience. The infographic above shows the median salary for each experience level, as well as a shaded area representing the middle 80% of earners in each experience group. This demonstrates that, while there is a large degree of overlap between men’s and women’s salaries, the highest male earners in most experience categories had higher wages than the highest female earners. Conversely, the lowest female earners with more than 10 years of experience made less than the lowest male earners with comparable levels of experience.

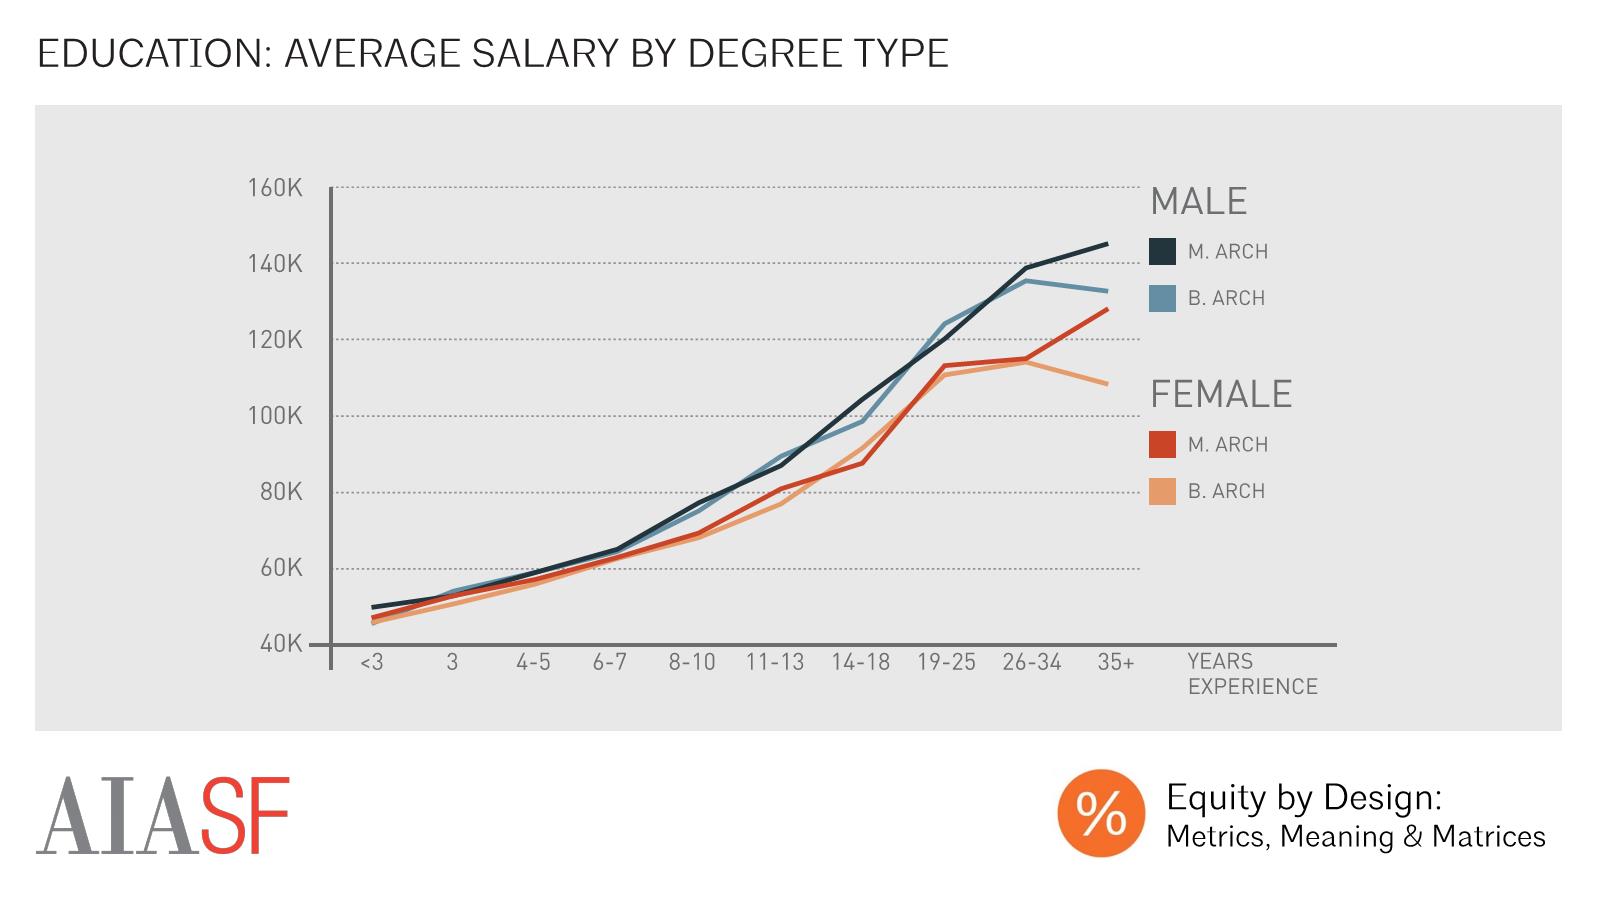
Education: Average Salary by Degree Type
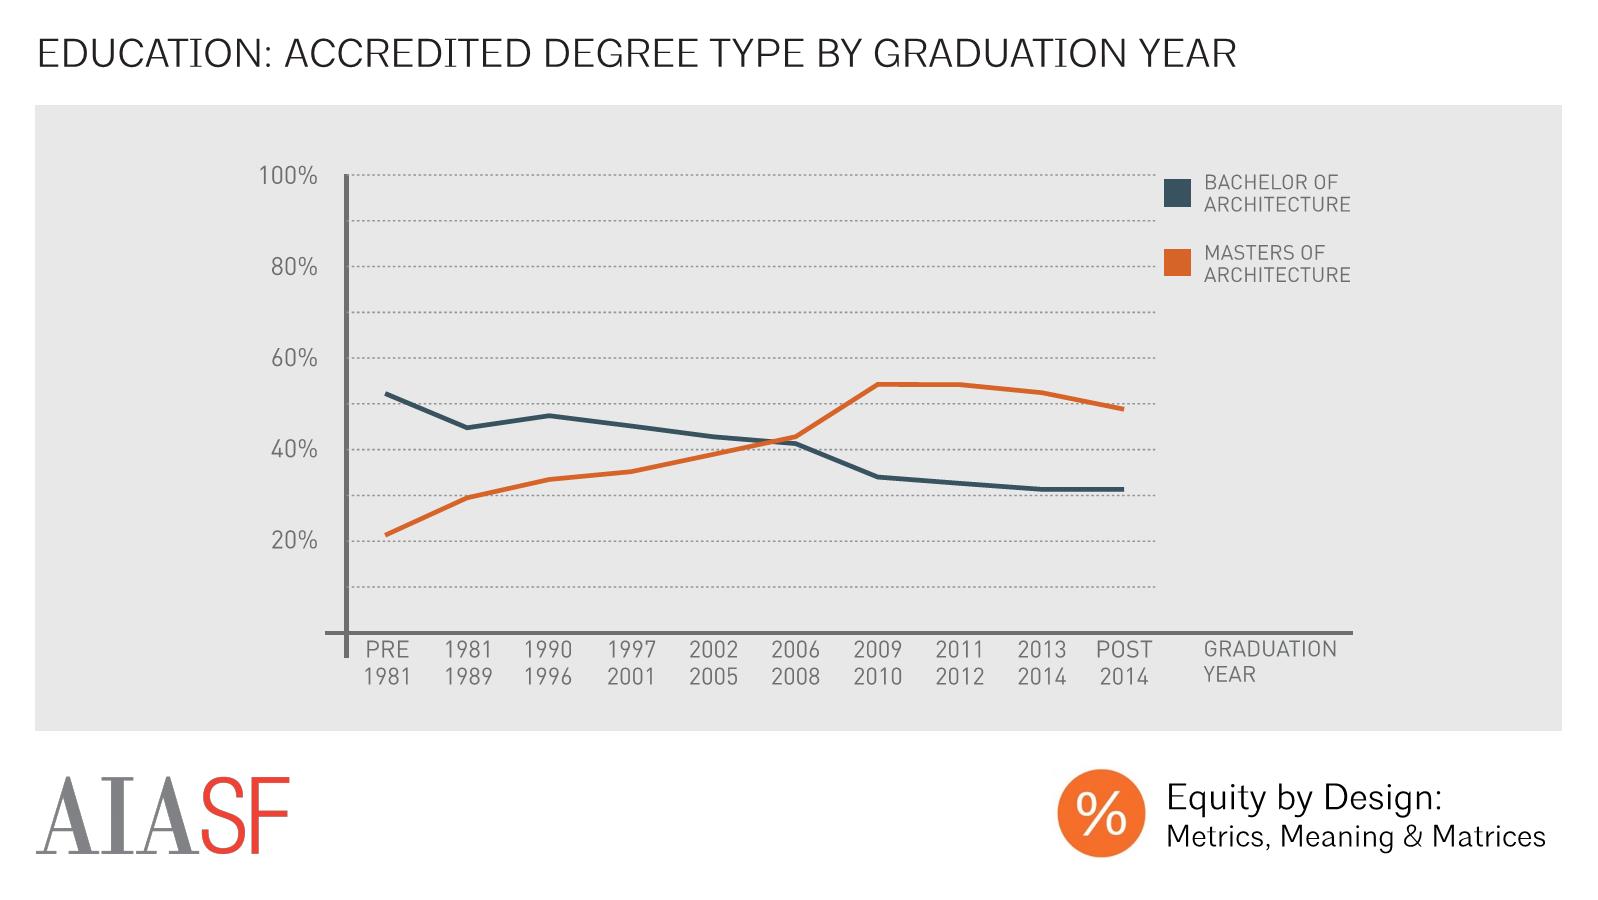
The Equity in Architecture Survey indicated that post-secondary degrees have become more common amongst architectural graduates in recent years. This movement towards higher levels of education wasn’t, however, correlated with higher earnings. At every experience level, we found that earnings were comparable for those with and without graduate degrees, meaning that men with Bachelor’s degrees earned more, on average, than women with Master’s degrees.


Average Salary by Licensure Status
One’s professional credentials were also important predictors of salary. Licensed architects made more, on average, than their unlicensed counterparts at every level of experience, with the largest differences in earnings amongst those with the most experience. The salary increase associated with licensure was greater for male respondents than it was for female respondents. Adjusted for experience, licensed men receiving a boost of approximately $8k per year while licensed women received a boost of only $4k per year.

Experience-Adjusted Wages by Professional Org Membership
Membership in a professional organization was also correlated with increased earnings for respondents of both genders. AIA, NCARB, and USGBC members made more than those who did not belong to any professional organizations at every level of experience. It’s worth noting that this correlation doesn’t necessarily prove that membership in a professional organization increases one’s earning potential. Each of these organizations has annual dues, which may be easier for those with elevated earnings to pay.
Average Salary by Professional Strength
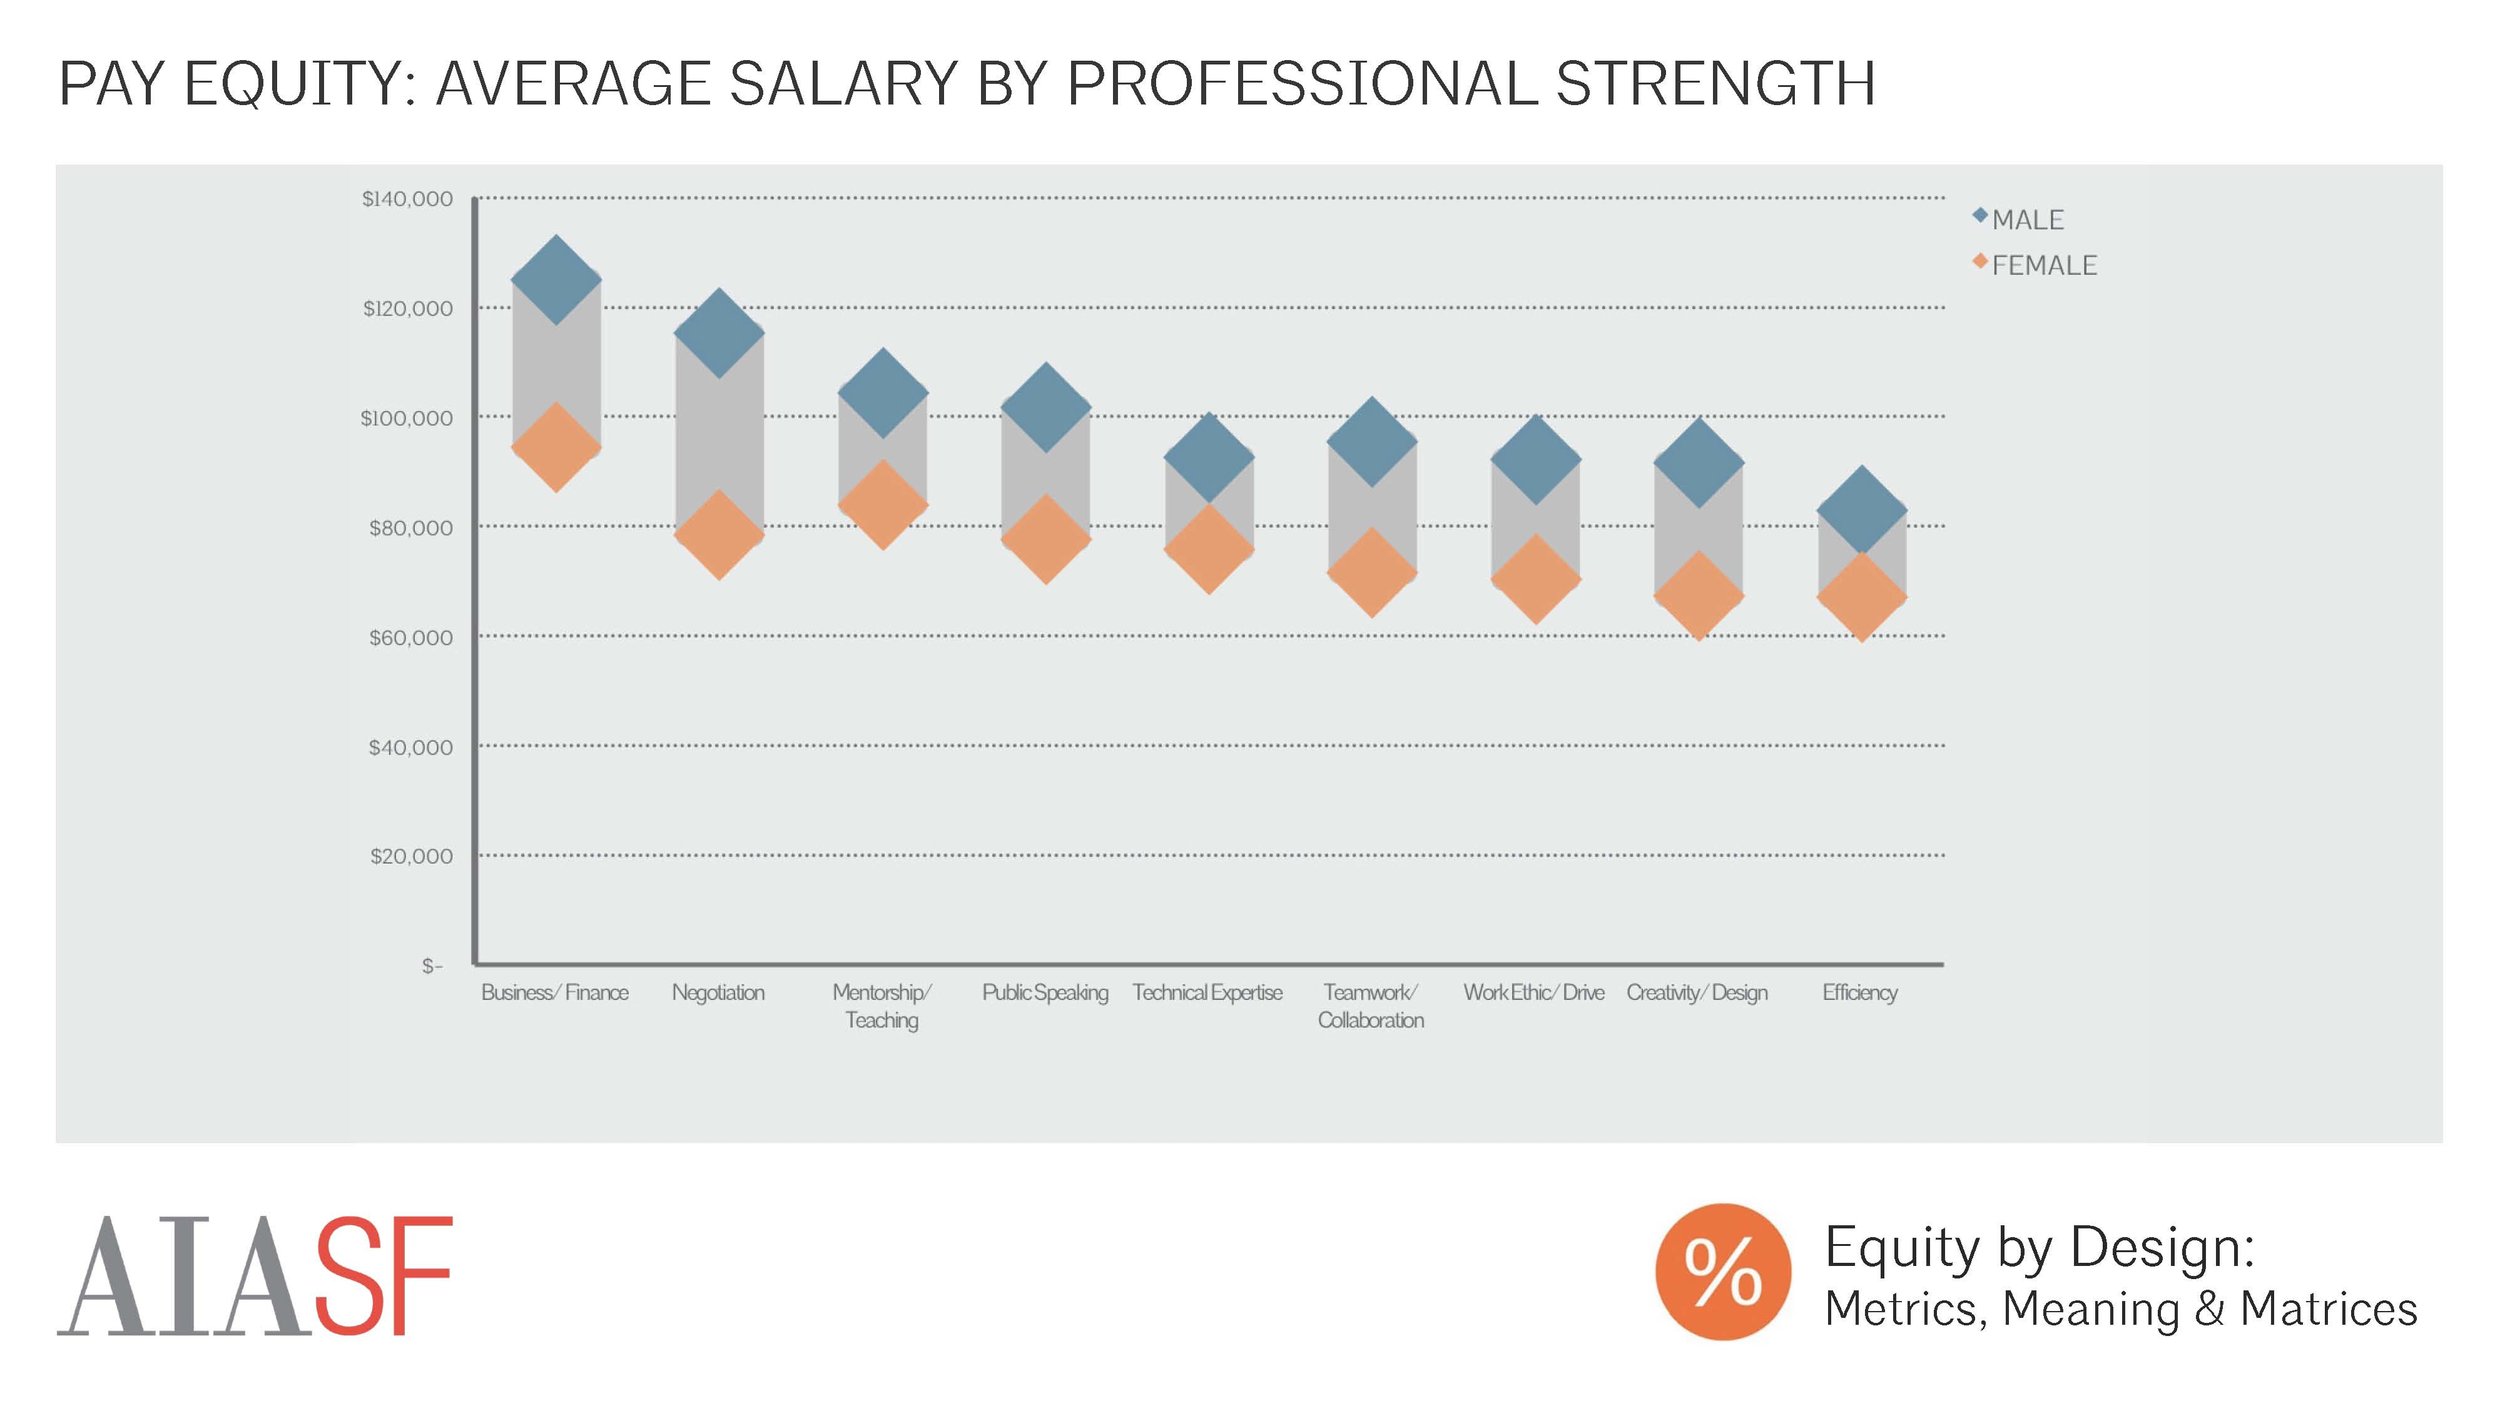
Respondents’ self-identified professional strengths were also correlated with differences in earnings. Those who reported specialized strengths in “business and finance”, “negotiation”, or “mentorship and teaching” averaged the highest earnings. Meanwhile, those who listed more general traits like “work ethic and drive”, “creativity or design”, or “efficiency” as their greatest strengths made the least, on average. The largest gender-based earnings gap was between men and women who listed “negotiation” as a strength, with skilled male negotiators earning $37K gross, or $15K experience-adjusted, more on average than skilled female negotiators.

Average Salary by Number of Firms and Years of Experience
While there is anecdotal evidence that young practitioners routinely move between firms in pursuit of salary increases that exceed typical annual raises, the data from the 2016 Equity in Architecture demonstrates no significant correlation between one’s history of switching firms and average earnings.

Average Salary by Tenure at Firm and Years Experience
Meanwhile, the data shows that, amongst those with 8 or more years of experience, a longer tenure at one’s current firm was associated with higher pay. Together, these statistics demonstrate that, on average, staying with a single firm over a long time period is more financially rewarding than frequently moving between firms.

Experience-Adjusted Salary by Geographic Location
The geographic location of one’s firm was significantly correlated with both overall earnings, and with the size of the wage gap. Those working in major cities made more, on average, than those working outside of these metropolitan areas. After normalizing average salaries in the five most common locations from the survey to the national average of 14 years of experience, the highest average salaries were observed in San Francisco ($105,031 per year for men and $93,015 per year for women) and New York City ($102,718 annually for men and $94,331 for women).
The gender wage gap also varied considerably by office location, largely because men’s salaries varied considerably by geographic location while women’s salaries were more consistent across regions. The largest salary wage gaps were generally observed in the locations where men’s average salaries were highest, while smaller gaps were observed in locations where men’s average salaries were lower. In San Francisco, where experience-adjusted male respondents’ salaries were the highest in the nation, the average experience-adjusted female made $0.89 for every dollar a man earned. Meanwhile, in Seattle, WA, where the average experience-adjusted salary was actually lower than the national average, the average experience-adjusted female actually made more than the average experience-adjusted male -- $1.01 for every dollar that a man earned.

Average Salary by Years Experience - San Francisco vs. National
Similar to the national pattern, the wage gap in top metropolitan regions was at its widest amongst those with the most experience. In San Francisco, where the average wage gap was wider than the national average, men and women with 10 or fewer years of experience made comparable amounts, while, the wage gap amongst those with more than 10 years of experience was considerably larger than the national average. Much of this difference can be attributed to the fact that experienced male respondents working in San Francisco made considerably more than the national average, while experienced women working in this location made only marginally more than the national average salary.

Average Salary by Firm Size
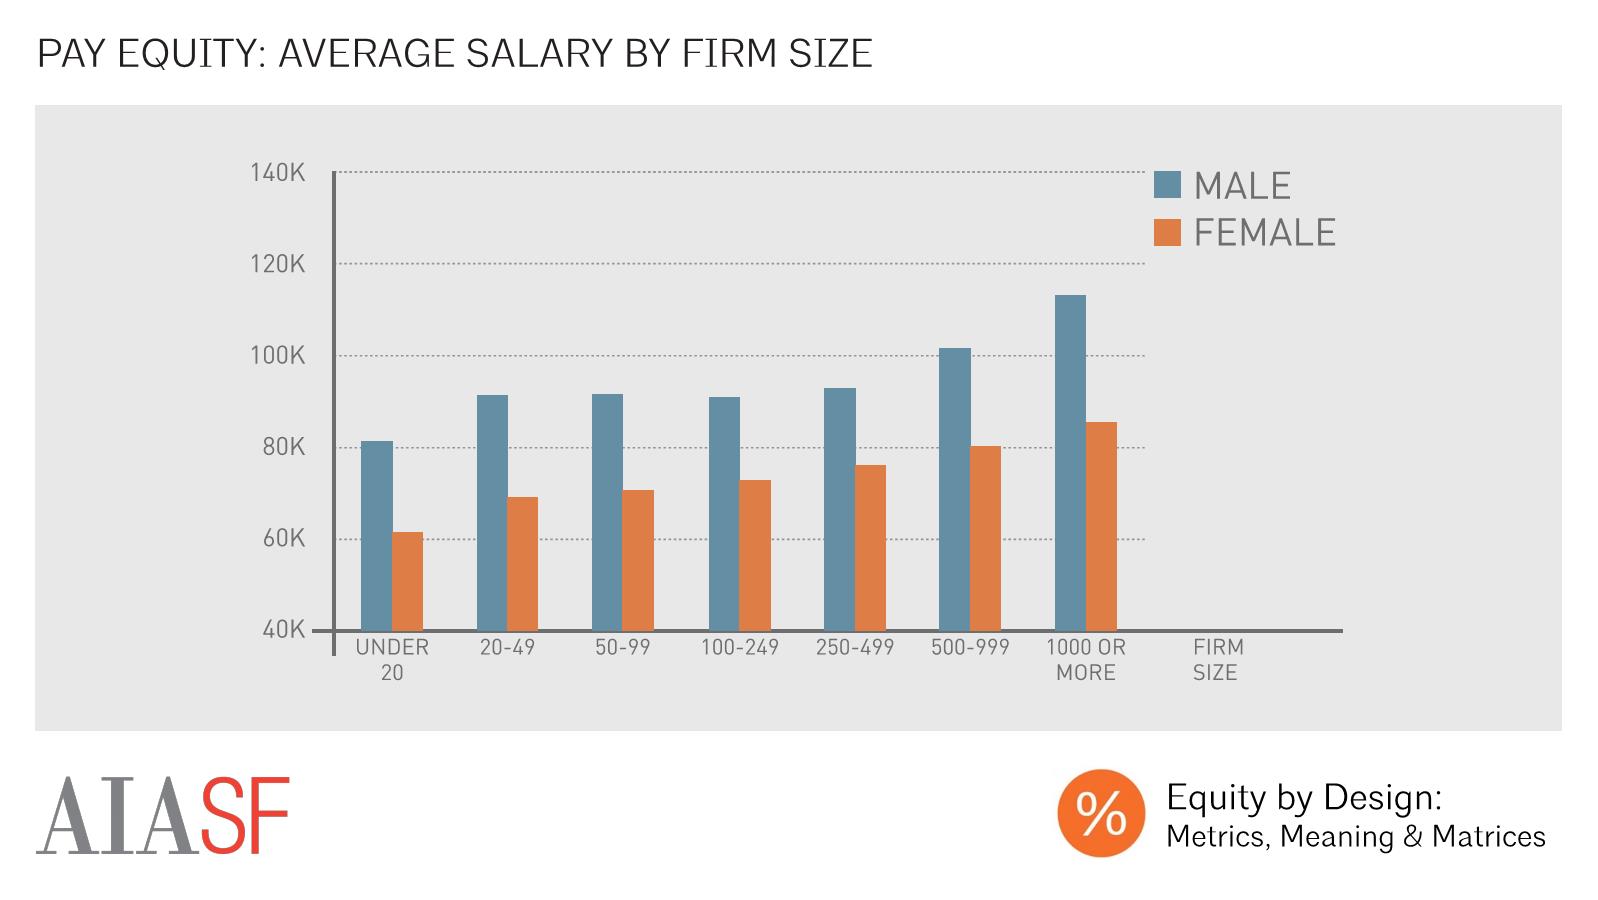
We also saw that firm size was correlated with wages, with those working in the largest firms making the most money on average. However, the relative difference in wages based on firm size was much smaller amongst female respondents than it was amongst men.

Experience-Adjusted Wages by Firm Size
Smaller, but still significant, differences in average annual pay were observed within most size categories after adjusting the data to account for differences in average experience level between male and female respondents. Again, the largest pay gap was observed within the largest firms. Male respondents working within these settings tended to make far more than the national average salary, while female respondents saw only minor increases above the average female salary for opting to work in these settings.

Average Salary by Project Role
One of the most important ways of looking at the wage gap is to assess whether respondents are receiving equal pay for equal work. Our data showed a gender-based wage gap for every project role, with the largest gap between male and female design principals.

Average Wages by Project Responsibility
Male respondents also made more, on average, than female respondents with equivalent project responsibilities. This was true for every project responsibility listed in the survey. The largest gross difference observed was for management of client relationships (pay gap of $26k/year gross, or $6k experience adjusted). The largest experience-adjusted pay gap was observed amongst those responsible for design leadership (pay gap of $22k/year, or $7k/year experience adjusted).

Average Wages by Office Management Responsibility
Female respondents made less, on average, than male counterparts with similar office management responsibilities. The largest gaps were observed between those responsible for marketing and new business development (pay gap of +$29k gross, or $9k experience adjusted), and strategic planning (pay gap of +$27k gross, or $9k experience adjusted)

Experience-Adjusted Salary by Work-Life Flex Importance
A side-by-side comparison of respondents’ experience-adjusted average salaries based upon gender and response to the question “How important is it to you that your job provides work-life flexibility, integration, or balance?” demonstrates that those who place higher importance on work-life flexibility, integration, or balance make less, on average, than those who view the issue as less important. Moreover, women’s average earnings vary considerably based on their response to this question, while men’s salaries vary more subtly based on work-life importance. This suggests that work-life prioritization is correlated with salary, and that decisions to prioritize work-life flex impact women disproportionately.

How Important is Work-Life Flex to You?
This phenomenon is particularly significant because female respondents were more likely than male respondents to report that work-life considerations were “extremely” or “very important” to them, and were less likely to report that they were “not too important”, or “not important at all.” Just three female respondents indicated that work-life flex was “not important” to them at all as a consideration.

Experience-Adjusted Salary by Work-Life Benefits Used
Use of work-life flexibility benefits was correlated with earnings, with the use of benefits that entailed working fewer hours correlated with decreased earnings, and the use of benefits that facilitated working outside of the office correlated with increased earnings. Women averaged lower earnings than men, regardless of which benefits they used.
There was an interesting gendered difference in the pay of those who used schedule flexibility benefits like comp time, core hours, and compressed schedules. Each of these benefits allows a user to trade time away from the work during some regular business hours for work conducted outside of the normal 9-5 workday. When adjusted for experience, men who reported using these benefits made more than men who said that they hadn’t used any work-life benefits. Meanwhile, women who used these benefits earned the same amount, or slightly less than women who reported using no work-life benefits.

Average Hourly Wage by Years Experience
All of this suggests that the average number of hours that one works, when coupled with experience level, is highly predictive of wages. In fact, respondents’ calculated hourly wages, which were derived from the average number of hours that a respondent reported working per week and reported annual earnings, were comparable for men and women with 10 years of experience or less. However, there were significant gender differences in hourly wages amongst more experienced professionals, with women earning less money per hour than male respondents.

Hours Worked per Week by Gender
The smaller gender difference between hourly wages than between absolute earnings suggests that female respondents reported averaging fewer hours per week. It’s worth considering why women might average fewer hours per week, and to ask ourselves whether a system whereby earnings are so heavily focused on the number of hours, and particularly overtime hours, is inherently biased against women, who tend to bear the load of caregiving and are often less able to work overtime due to these commitments. Are hours worked really the best measure of the value that one provides to a company? It’s not something that we can answer with our survey data, but something that we would like to research further in the future!

Average Salary by Caregiver Status
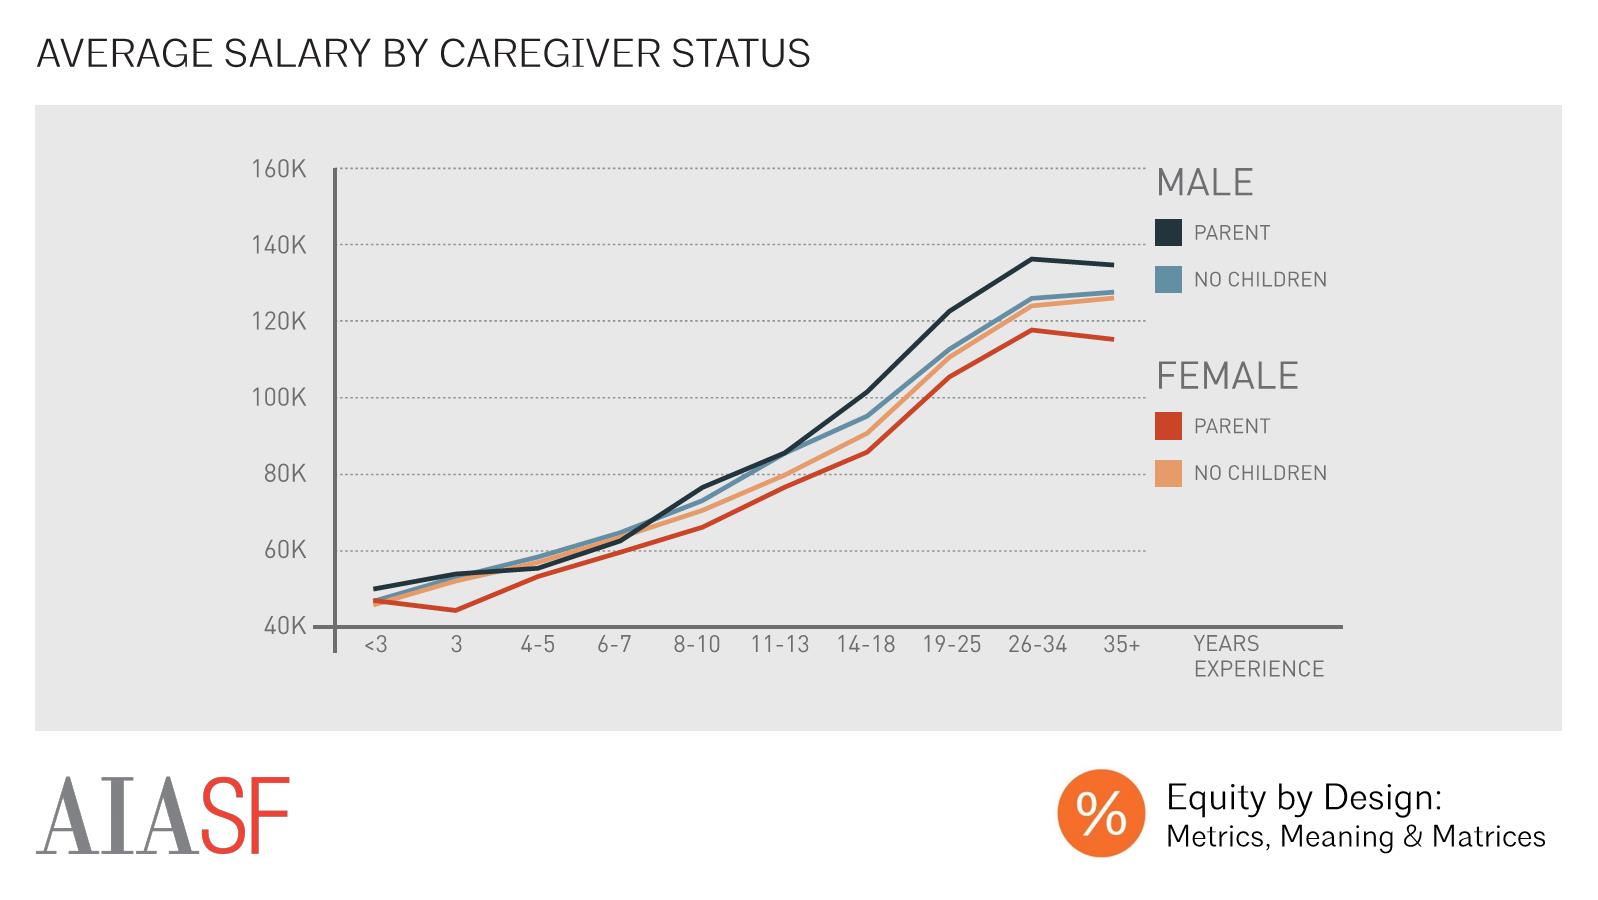
Parenthood was an important predictor of earnings, largely due to differences in mothers’ and fathers’ reported caregiving responsibilities, and the work settings and schedules that they chose in order to accommodate these responsibilities. We saw that, while men and women without children had similar average salaries by years of experience, fathers made more, on average, than men without children, while mothers made less, on average, than women with children.

Average Experience-Adjusted Salary by Reason for Alt Schedule
We saw additional evidence for the idea that childcare places an undue financial burden upon working women when we compared the experience adjusted salaries of men and women who reported working an alternative schedule (part time, comp time, core hours, or compressed) based on their reason for working that schedule. Men who chose an alternative schedule to accommodate childcare made the most money, on average, while women who worked one of these types of schedules to accommodate childcare earned the least, on average.

Average Salary by Experience When Oldest Child Born
The timing of the birth of one’s child relative to one’s professional development was significant. By subtracting respondents’ children’s ages from their level of experience, we were able to approximate their level of experience at the time of the birth of their children. This analysis revealed that fathers’ salaries were comparable to, or exceeded, those of their counterparts without children, no matter when in their career their oldest child had been born. Those who had become fathers when they had four or fewer years of experience made less, on average, than those who had become fathers later in their careers. Meanwhile, mothers tended to make less than their counterparts without children at most stages in their careers. The only exception was amongst women who had become mothers with 8-10 years of experience. These women made comparable amounts to, or even more than, their counterparts without children.

Average Salary by Experience When Youngest Child Born
Amongst female respondents, patterns in earnings related to when one’s children were born were even more significant when we considered a respondent’s experience level at the time of the birth of her last child. Women whose youngest child was born when they had seven or fewer years of experience in the field made substantially less, on average, than women without children as well as women who had finished giving birth later in their careers. This difference in earnings was at its largest amongst those with the most experience, suggesting either that the penalties related to motherhood were much more significant in the past than they are today, or that the impact of having children at the beginning of one’s career lingers late into one’s career. Like their female counterparts, men who had finished having children early in their career made less, on average, than fathers who had amassed more professional experience before the birth of their last child. However, these differences in salary on that basis of work-life sequencing were far smaller for fathers than they were for mothers.

The kinds of attention that firm leaders pay to their employees are strongly correlated with employee salary. After adjusting for experience, individuals who received feedback on their embodiment of firm values, their leadership traits, and their business development skills during the performance review process made more, on average, than those who did not receive this type of feedback. Meanwhile, those individuals who reported that their firm did not have a performance review process, or who did not know the criteria for performance evaluation, made less, on average. In all cases, the performance review process was more strongly predictive of male respondents earnings than of female respondents’ earnings.
As discussed in the last article, individuals’ schedules were strongly predictive of earnings. Respondents of both genders who reported that they never worked overtime made substantially less, on average, than those who did reported working overtime, with male respondents who never worked overtime averaging about $23K less than those who did, and women who never worked OT averaging $17k less. Meanwhile, female respondents faced a steeper penalty for working a part-time schedule, with part-time female employees averaging $13k less than full-time female employees while part-time male employees averaged $8k less than full-time male employees.

Receiving career guidance from a senior leader within one’s own firm was also strongly correlated with higher annual earnings. Amongst respondents with 8 or more years of experience, the wage difference associated with mentorship was larger for male respondents than for female respondents, suggesting that men may reap larger financial rewards from their mentor-mentee relationships with firm leaders.

Respondents who indicated that their had a sponsor, or someone who advocated for them, within their firm also earned more, on average, than those who did not have such a person. Once again, the identity of one’s sponsor was a significant predictor of earnings. In this case, however, having a peer advocate was at least as beneficial as having an advocate in management, especially amongst more experienced respondents. This may be because many respondents with more than 18 years of experience were in management themselves, suggesting that even firm leaders need peer advocates within their organization’s management structure. More analysis would be required to explore why respondents with peer advocates made more, on average, than those with advocates in mid-level management.

Contrary to conventional wisdom, female respondents were actually more likely to indicate that they had negotiated their salary in the past. Most of this difference, however, can be attributed to similar difference in male and female respondents’ likelihood of saying that they had always been satisfied with their salary offers. In other words, women were more likely to negotiate, but only because they were less likely to be offered a satisfactory wage in the first place.

Amongst those who had negotiated their salary, respondents of both genders had high rates of success, with roughly ⅔ of respondents receiving either the full amount that they had requested, or an increased offer that was smaller than their initial bargaining position. Male negotiators, however, were slightly more likely to receive the full amount that they had requested, while female negotiators were slightly more likely to receive a partial amount.

Compared to those who were dissatisfied, but did not negotiate, and even to those who had always been satisfied with their salary offers and had never felt the need to negotiate, negotiators of both genders made more, on average, at nearly every level of experience. Compared to those who had always been satisfied, these increases were quite modest, however, for female negotiators. Male negotiators with more than 13 years of experience, on the other hand, made significantly more than those who had always been satisfied with their earnings. This suggests that female negotiators were adept at negotiating for earnings that were considered “fair”, while male negotiators tended to pull in salaries well above the average.
Work-Life Challenges Faced
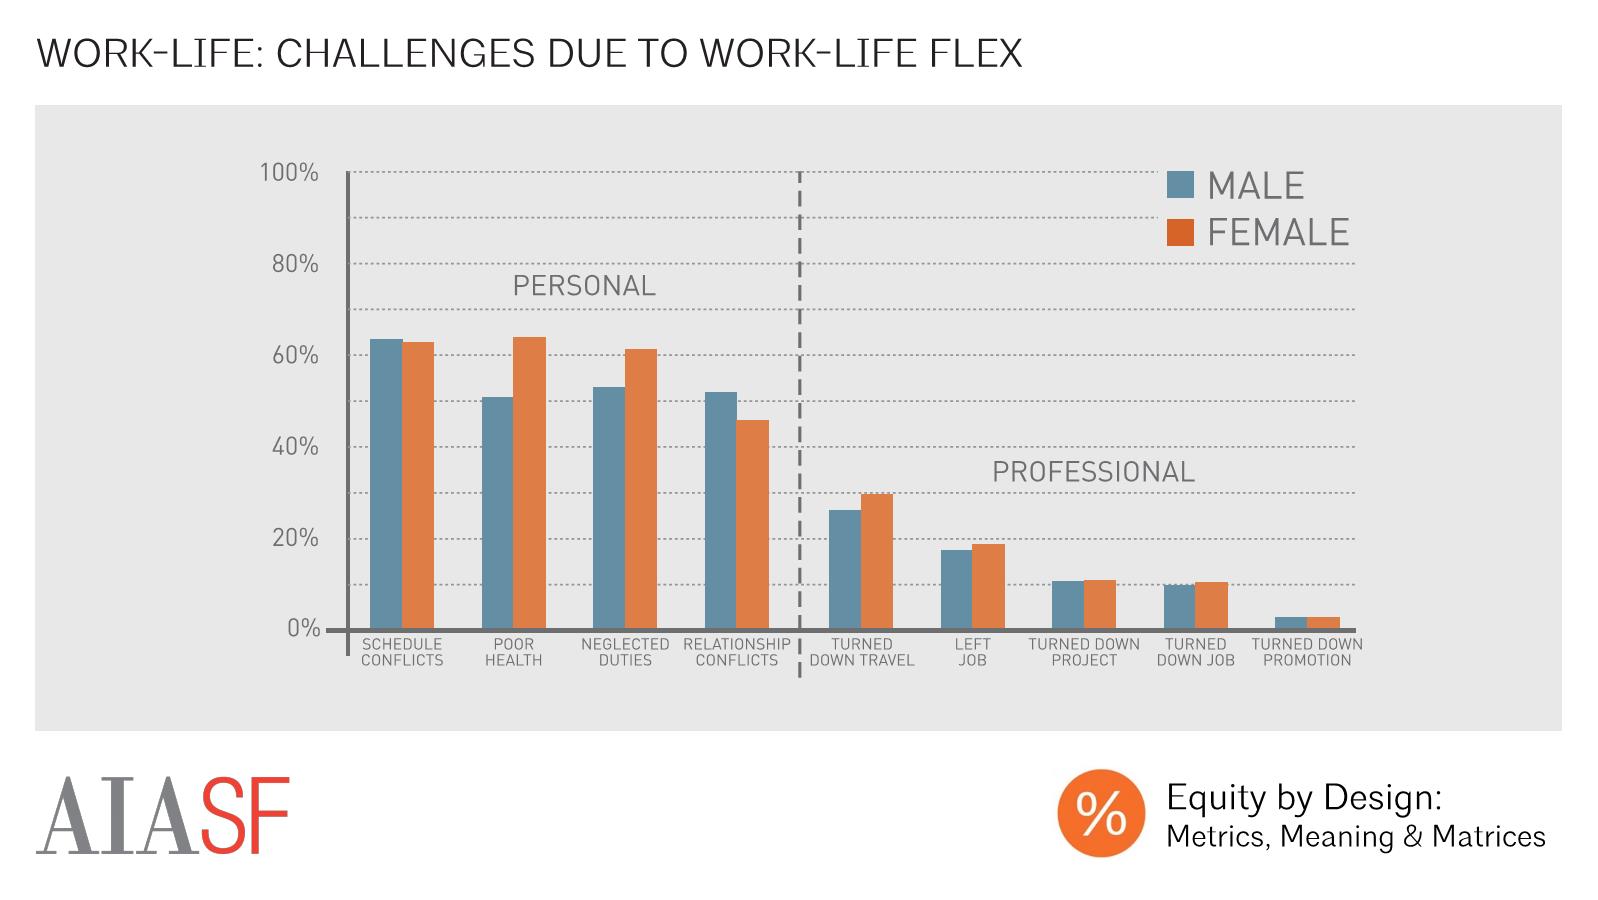
Not only did our female respondents make less money on average than their male counterparts, but they were more likely to report having faced a host of work-life conflicts, from poor health and neglected personal duties to turning down travel or even leaving a job. It’s also important to note that our respondents, both male and female, were much more likely to report facing personal setbacks in the face of work-life conflict than they were to report making professional trade-offs in these situations.

How Important is Work-Life to You?
Work-life considerations factor strongly into the architectural professionals’ career decisions, regardless of their identity. The vast majority of our respondents report that it was “extremely” or “very important” that their job provided work-life flexibility, integration or balance. In fact, only 4% of men, and 1% or women, believe that these issues were “not too important” or “not important at all.”

Work-Life Challenges
While respondents tended to believe that it was important to strike an appropriate work-life relationship, many reported that they had faced challenges in this arena. Women were were more likely to report having faced a host of work-life conflicts, from poor health and neglected personal duties to turning down travel or even leaving a job. It’s also important to note that our respondents, both male and female, were much more likely to report experiencing personal setbacks in the face of work-life conflict than they were to report making professional trade-offs in these situations.
"I Have Time to Pursue my Interests Outside of Work'
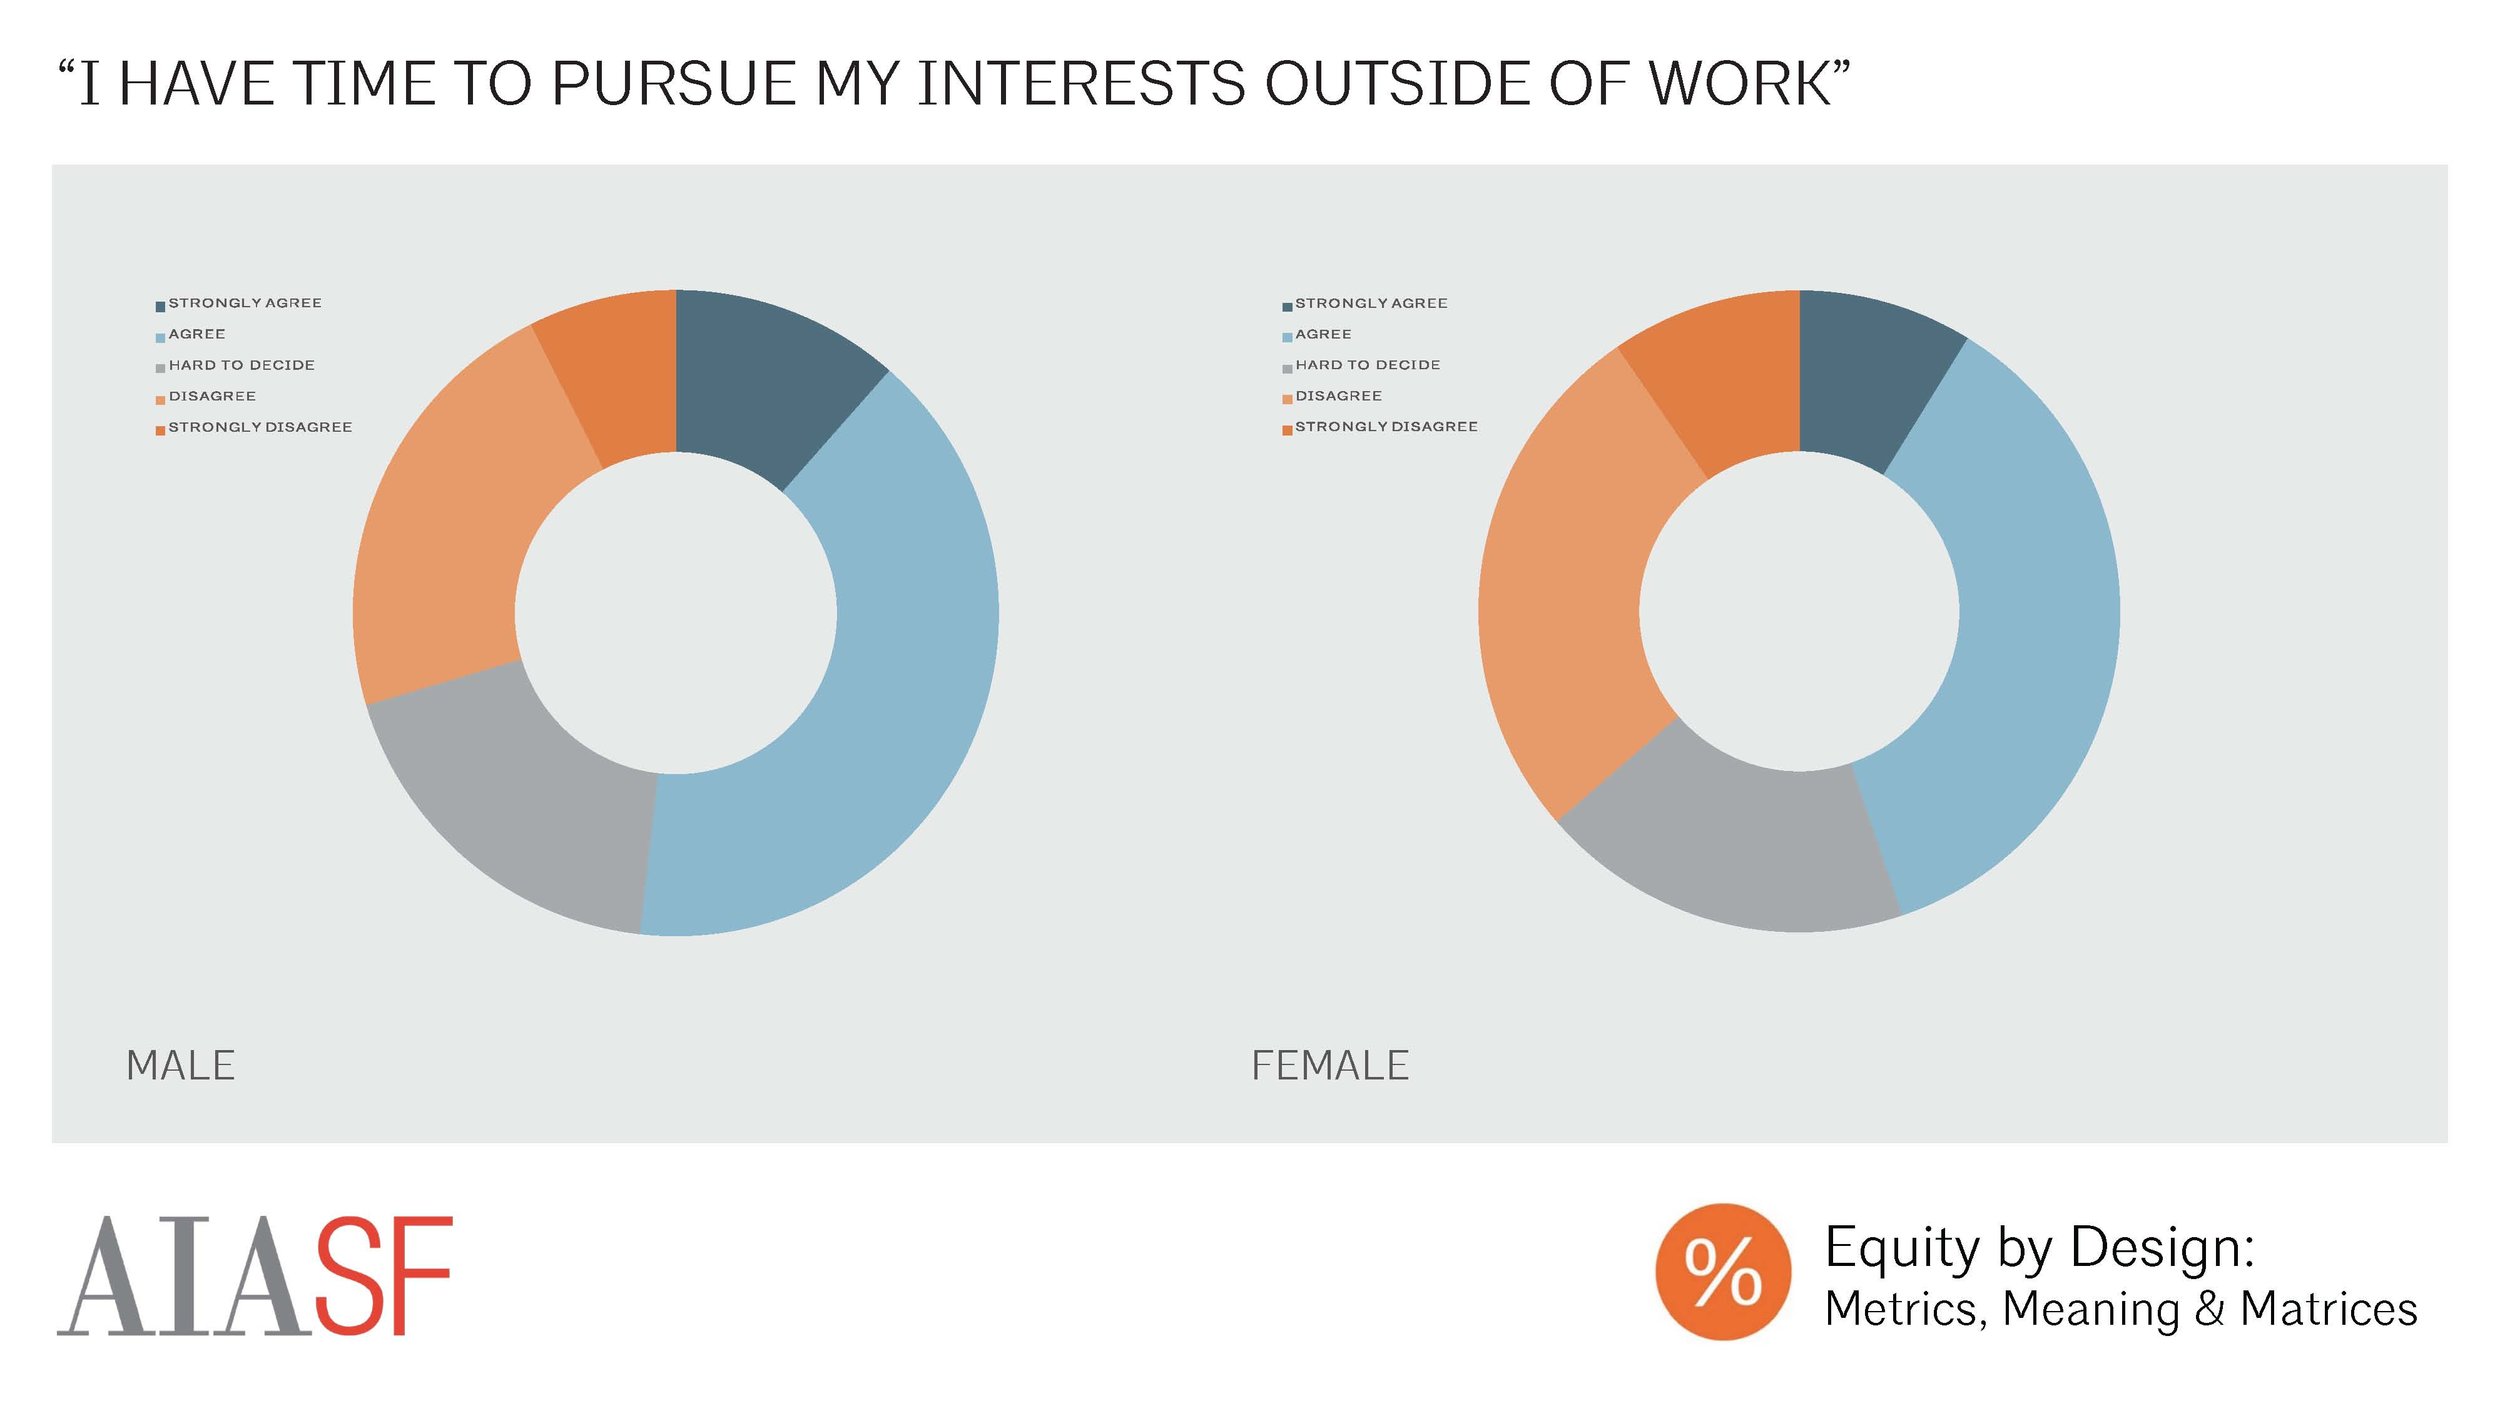
Overall, respondents’ perceptions of their work-life flexibility were relatively low. Just 52% of male respondents, and 45% of female respondents, agreed or strongly agreed with the statement “I have enough time and energy to pursue my interests outside of work.”

"I Have Enough Time to Complete my Work"
Similarly, many respondents reported that their workloads were too great, with one in four respondents disagreeing with the statement “I have enough time to complete my work.”

Burnout/Engagement Likelihood by Gender
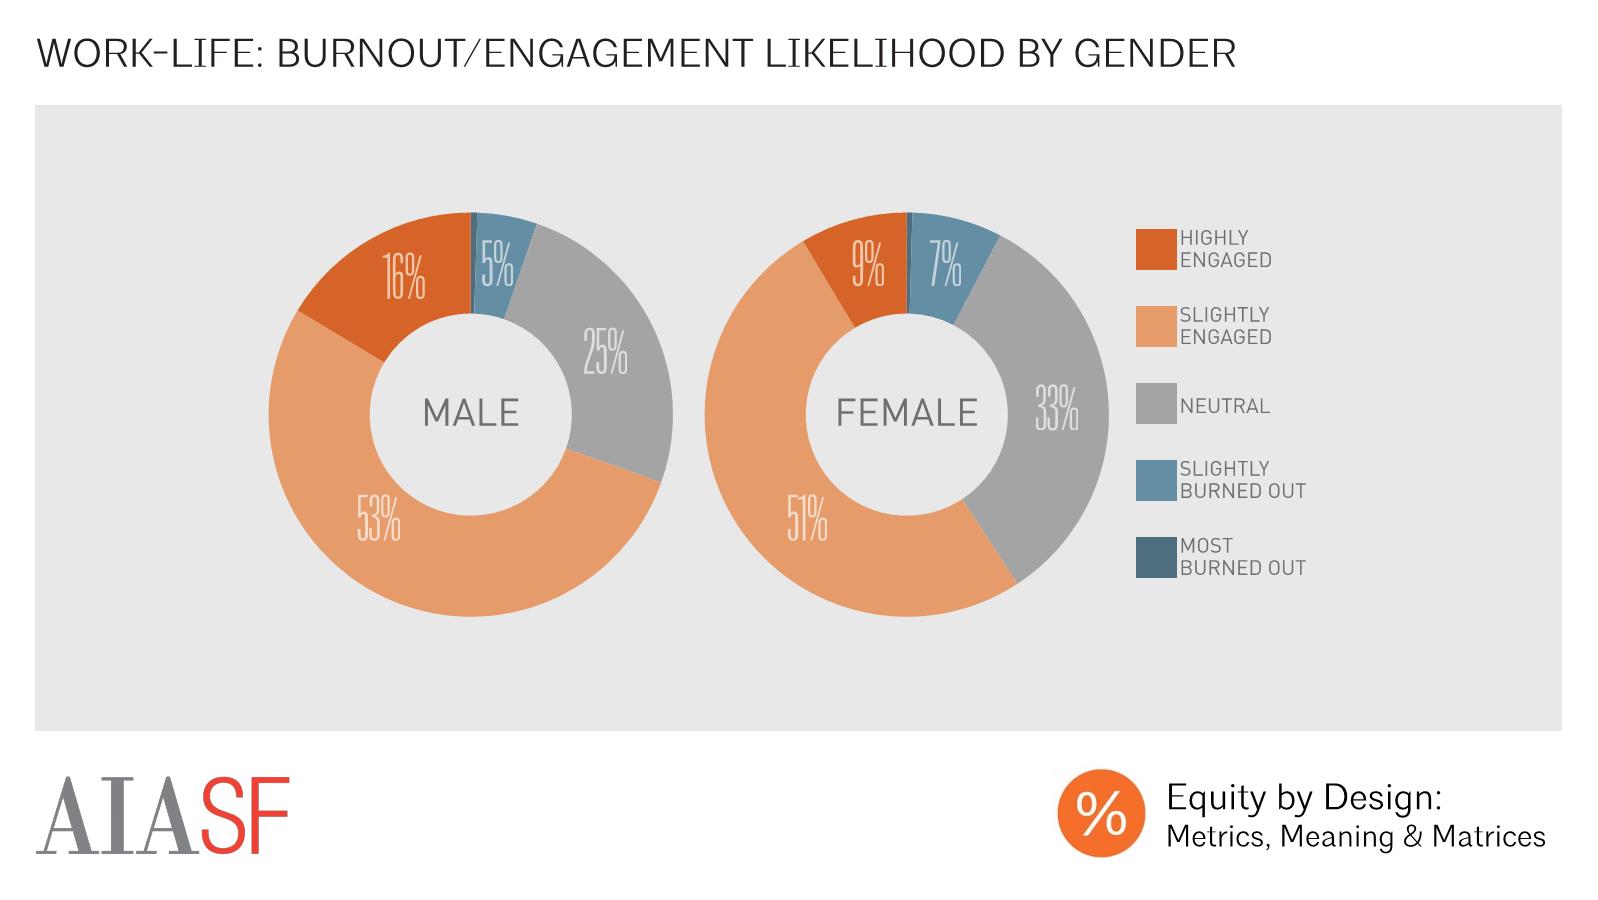
Another way of looking at work-life is by considering burnout and engagement, which are considered to be opposite conditions for the purposes of our data analysis. According to research, burnout is identified by feeling exhausted by one’s work, a lack of focus or involvement in one’s work, and doubting one’s ability to meet expectations. Meanwhile, engagement is characterized by feeling energized by work, feeling involved or focused on work, and believing one has the ability to meet or exceed expectations. Our study showed that most respondents, male and female, were either highly or slightly engaged. Female respondents were slightly more likely than their male counterparts to exhibit signs of burnout.
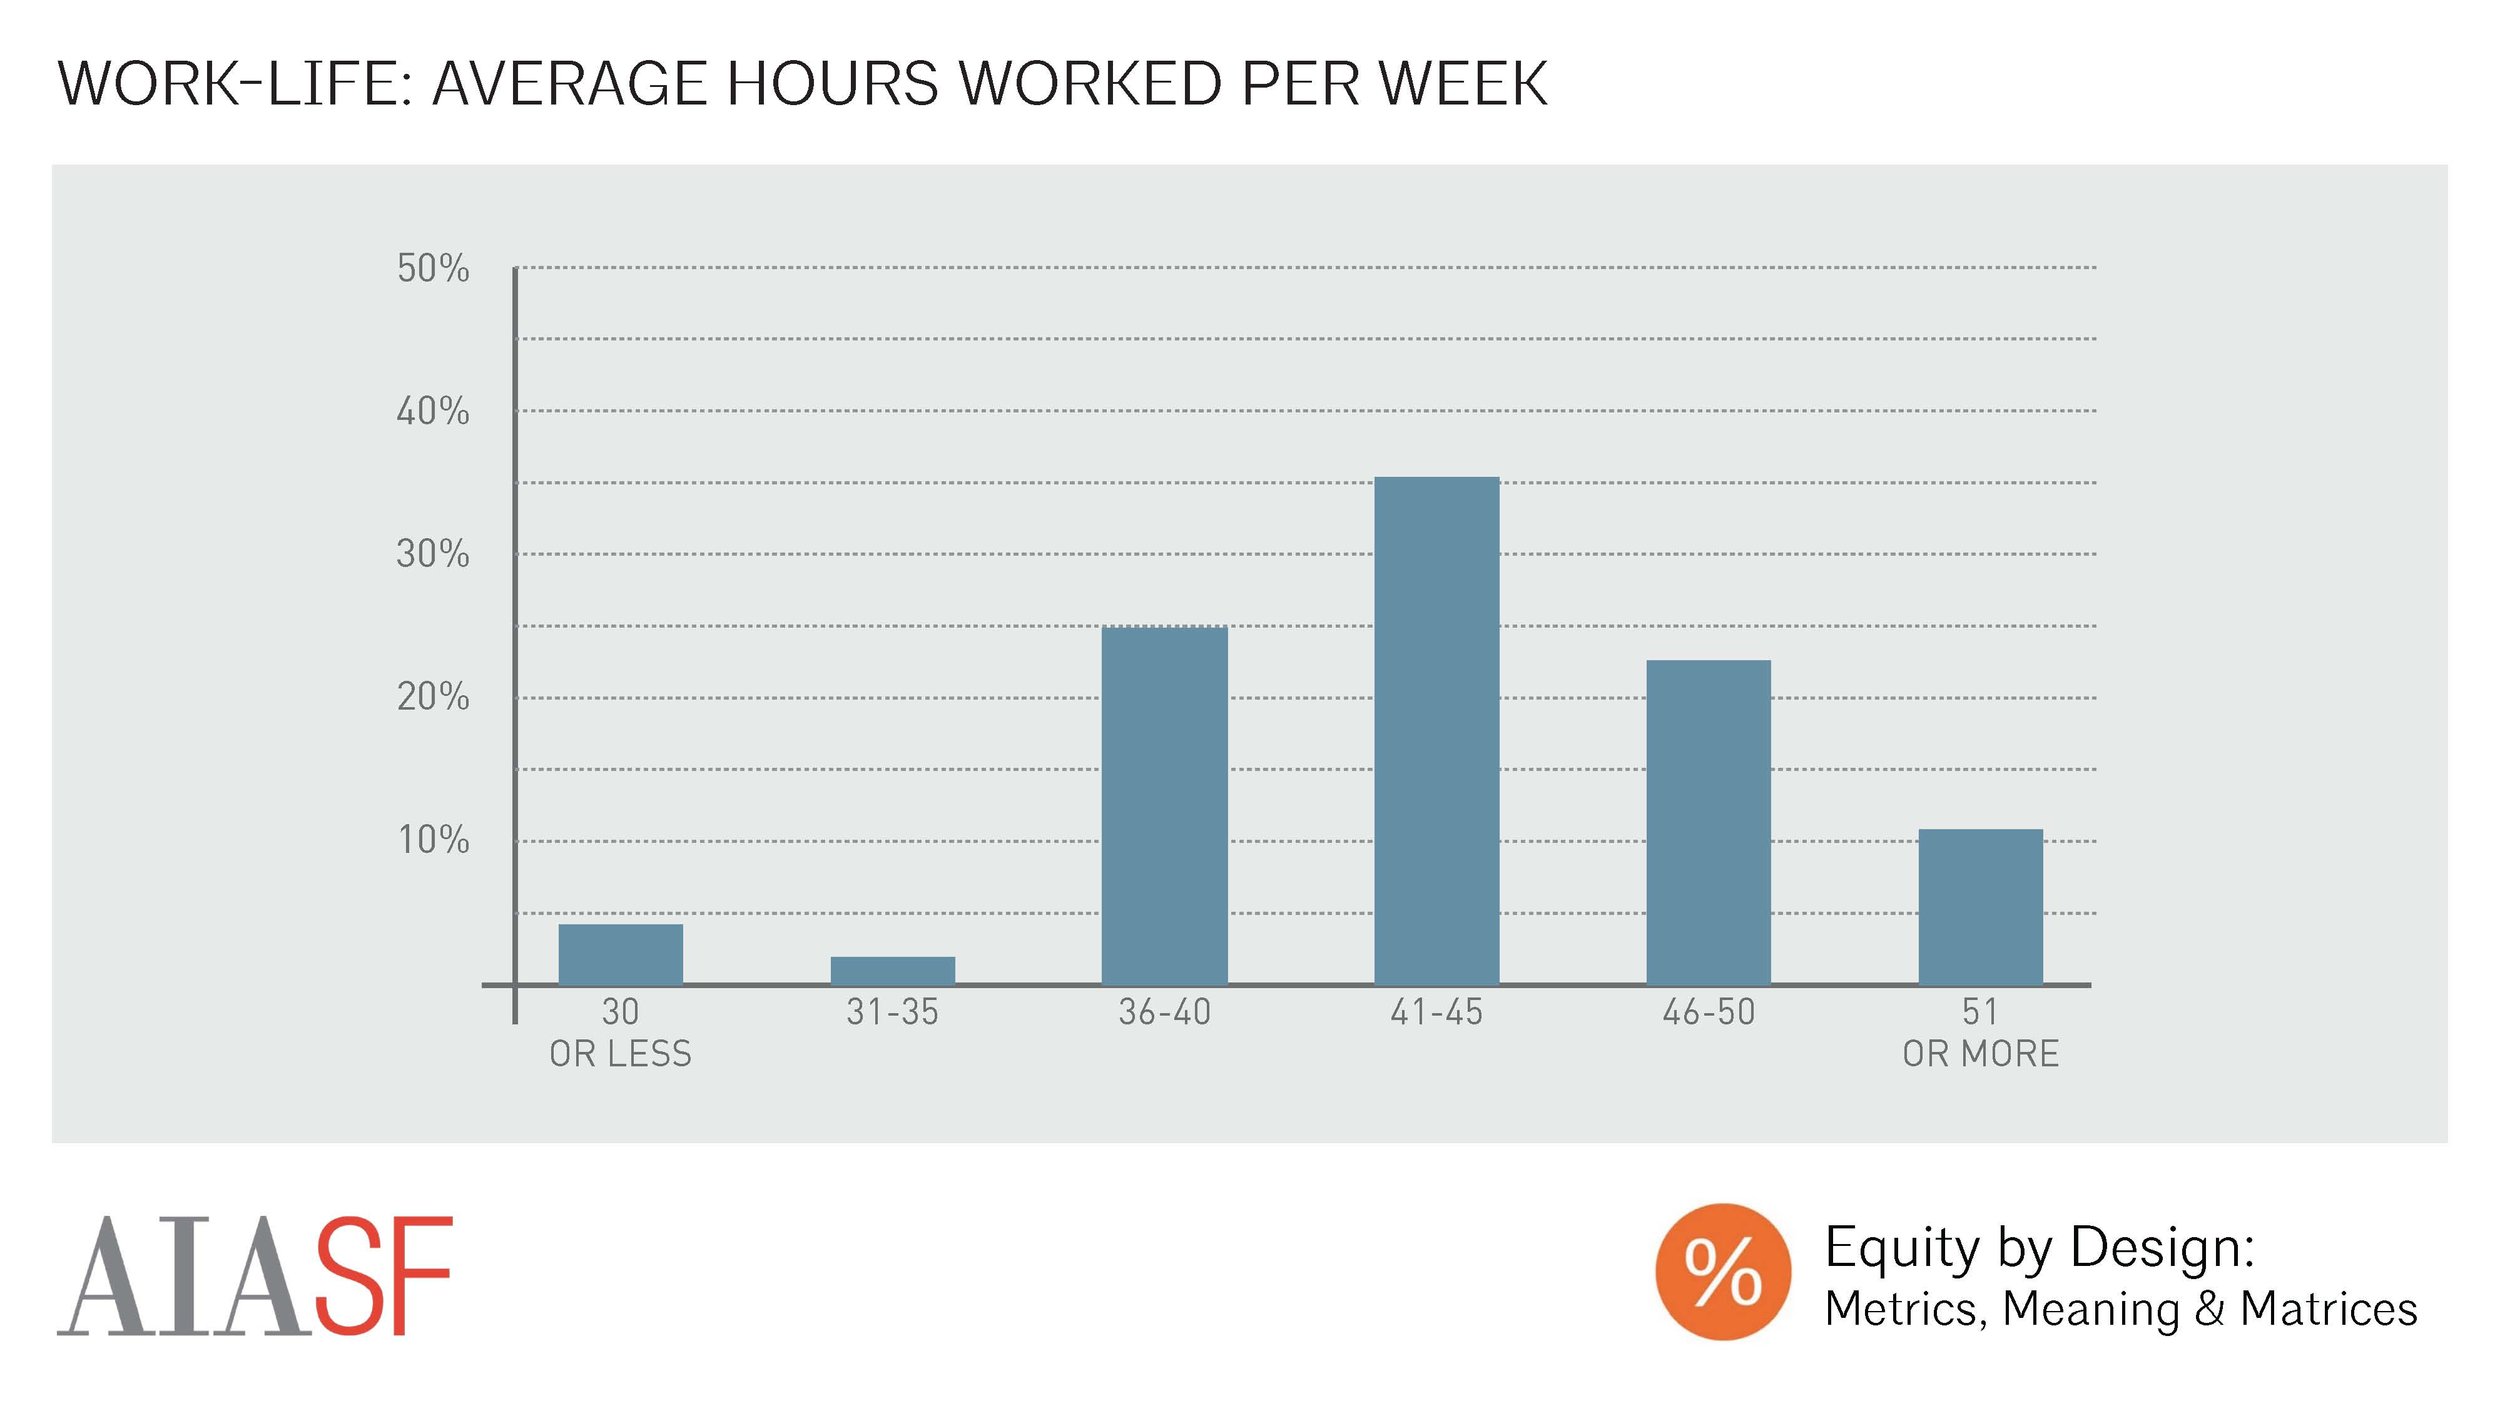
Average Number of Hours Worked per Week
Given the prevalence of work-life conflict, we were surprised to learn that the majority of our respondents worked between 40 and 50 hours a week. This suggests that the average number of hours worked per week may not be the best indicator of whether work-life flexibility is an issue for someone.

Top Correlations: "I Have Time to Pursue Interests Outside of Work"
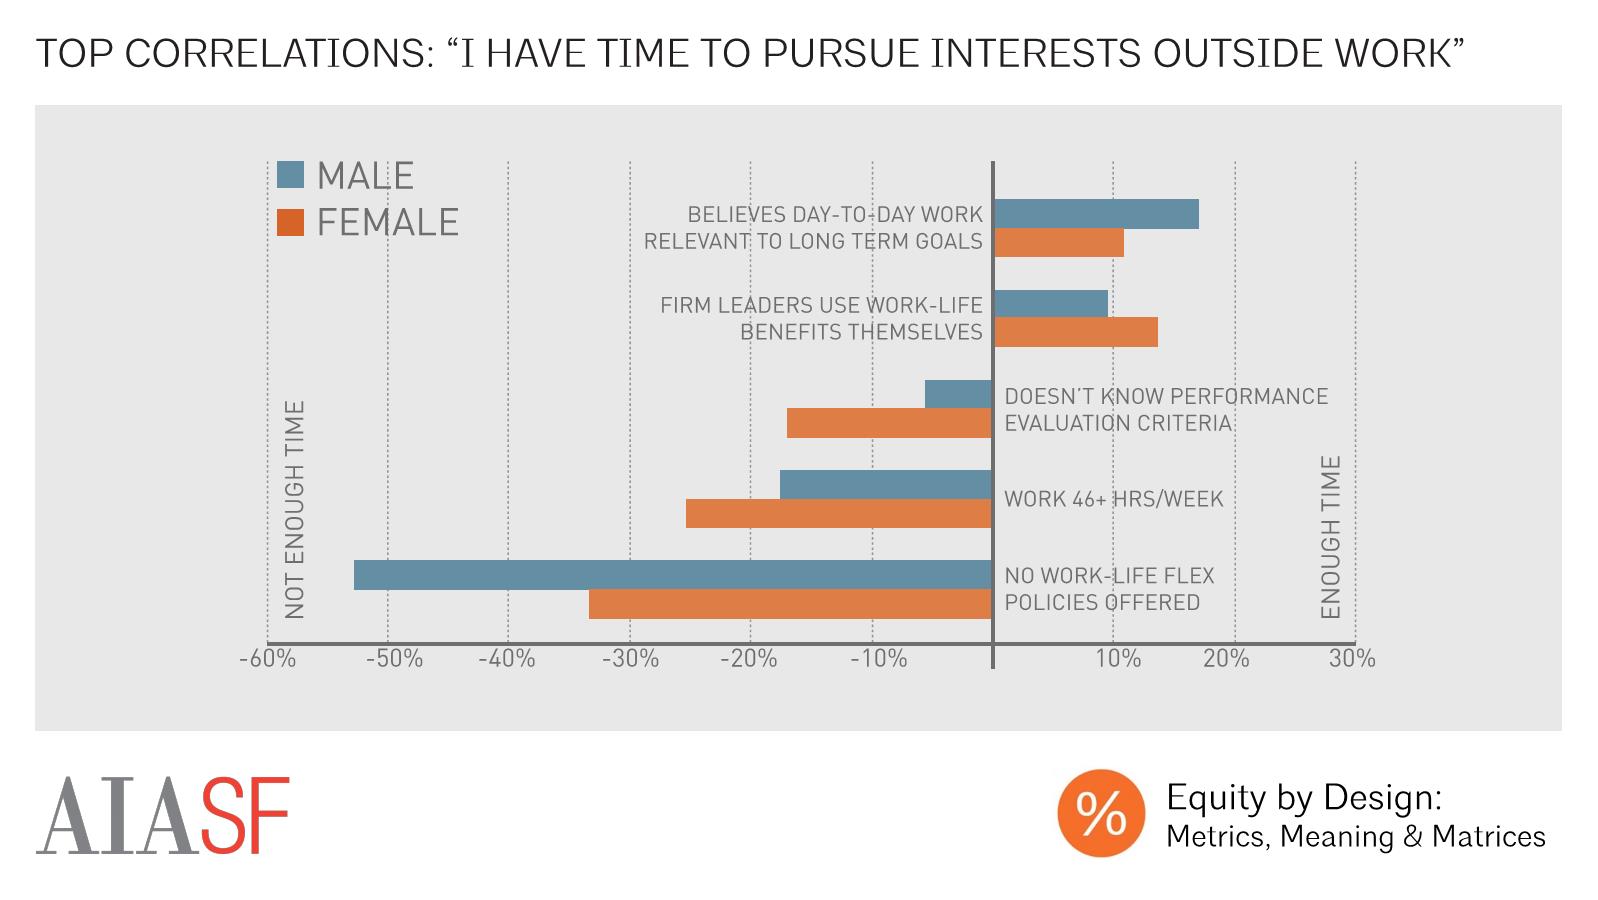
The top predictors of whether a respondent reported having enough time to pursue interests outside of work were whether they believed their day-to-day work was relevant to long-term goals, and whether their firm’s leaders used work-life benefits themselves. Meanwhile, not knowing performance evaluation criteria, working more than 46 hours a week, and working in a firm without work-life flex policies were associated with negative perceptions of work-life

Top Correlations: "I Have Enough Time to Complete my Work"
A respondent’s assessment of one’s workload was another key factor in evaluating work-life flexibility. The top predictors of whether a respondent agreed with the statement “I have enough time to complete my work” were the belief that one’s day-to-day work was relevant to long term goals, being paid more than hourly wage for overtime, and using job sharing. Meanwhile, receiving no overtime compensation, and not knowing performance evaluation criteria were associated with more negative perceptions of workload. Overall, these trends suggest that working in an environment where one’s time is valued -- by making sure that work is relevant to one’s personal goals, and by investing in one’s time either by paying for overtime hours, or by allowing employees to share jobs to allow for part-time schedules -- is critical to managing one’s workload.

Top Correlations: Burnout & Engagement
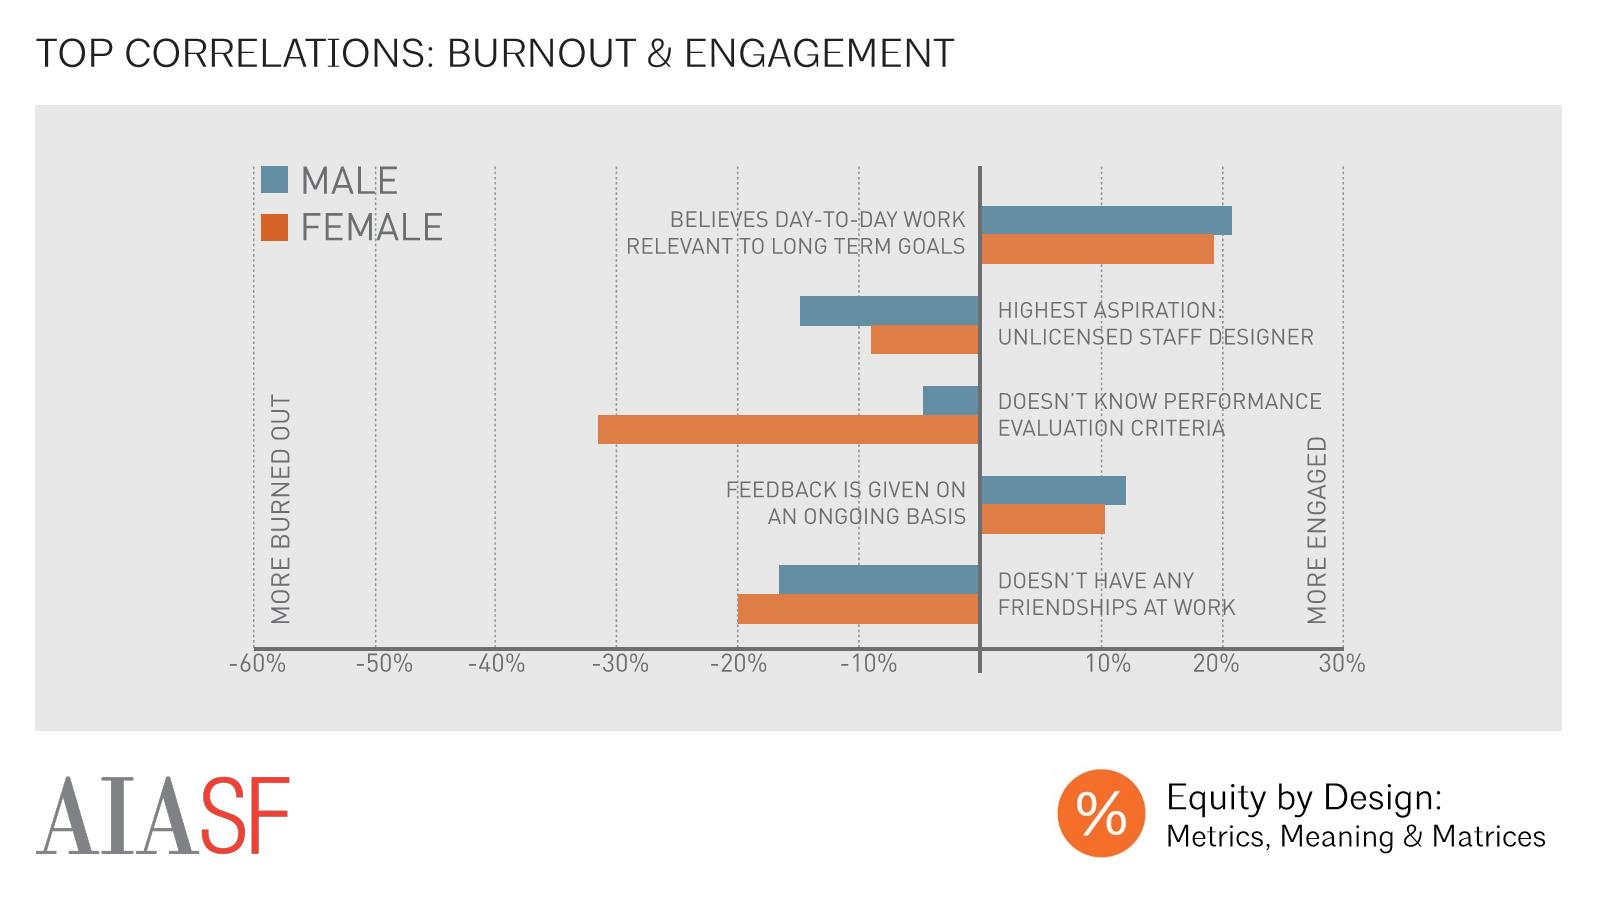
The top predictors of burnout were not having friendships at work, aspiring to be an unlicensed staff designer, and not knowing the criteria for performance evaluation. Meanwhile, believing day-to-day work was relevant to long-term goals and receiving feedback on an ongoing basis were associated with higher levels of engagement.

Top Correlations: Has Faced Personal Work-Life Challenges
Overall, the top predictors of whether a respondent reported having made personal trade-offs in the face of work-life challenges were working 46 or more hours per week, being expected to work as much as necessary to meet deadlines, and being paid more than one’s hourly wage for overtime. Meanwhile, having access to in-house or subsidized daycare and reporting that one never worked overtime were associated with decreased likelihood of personal trade-off. In short, workplaces that incentivized or created expectations of overtime were associated with increased likelihood of making sacrifices in one’s personal life in the face of work-life challenge.
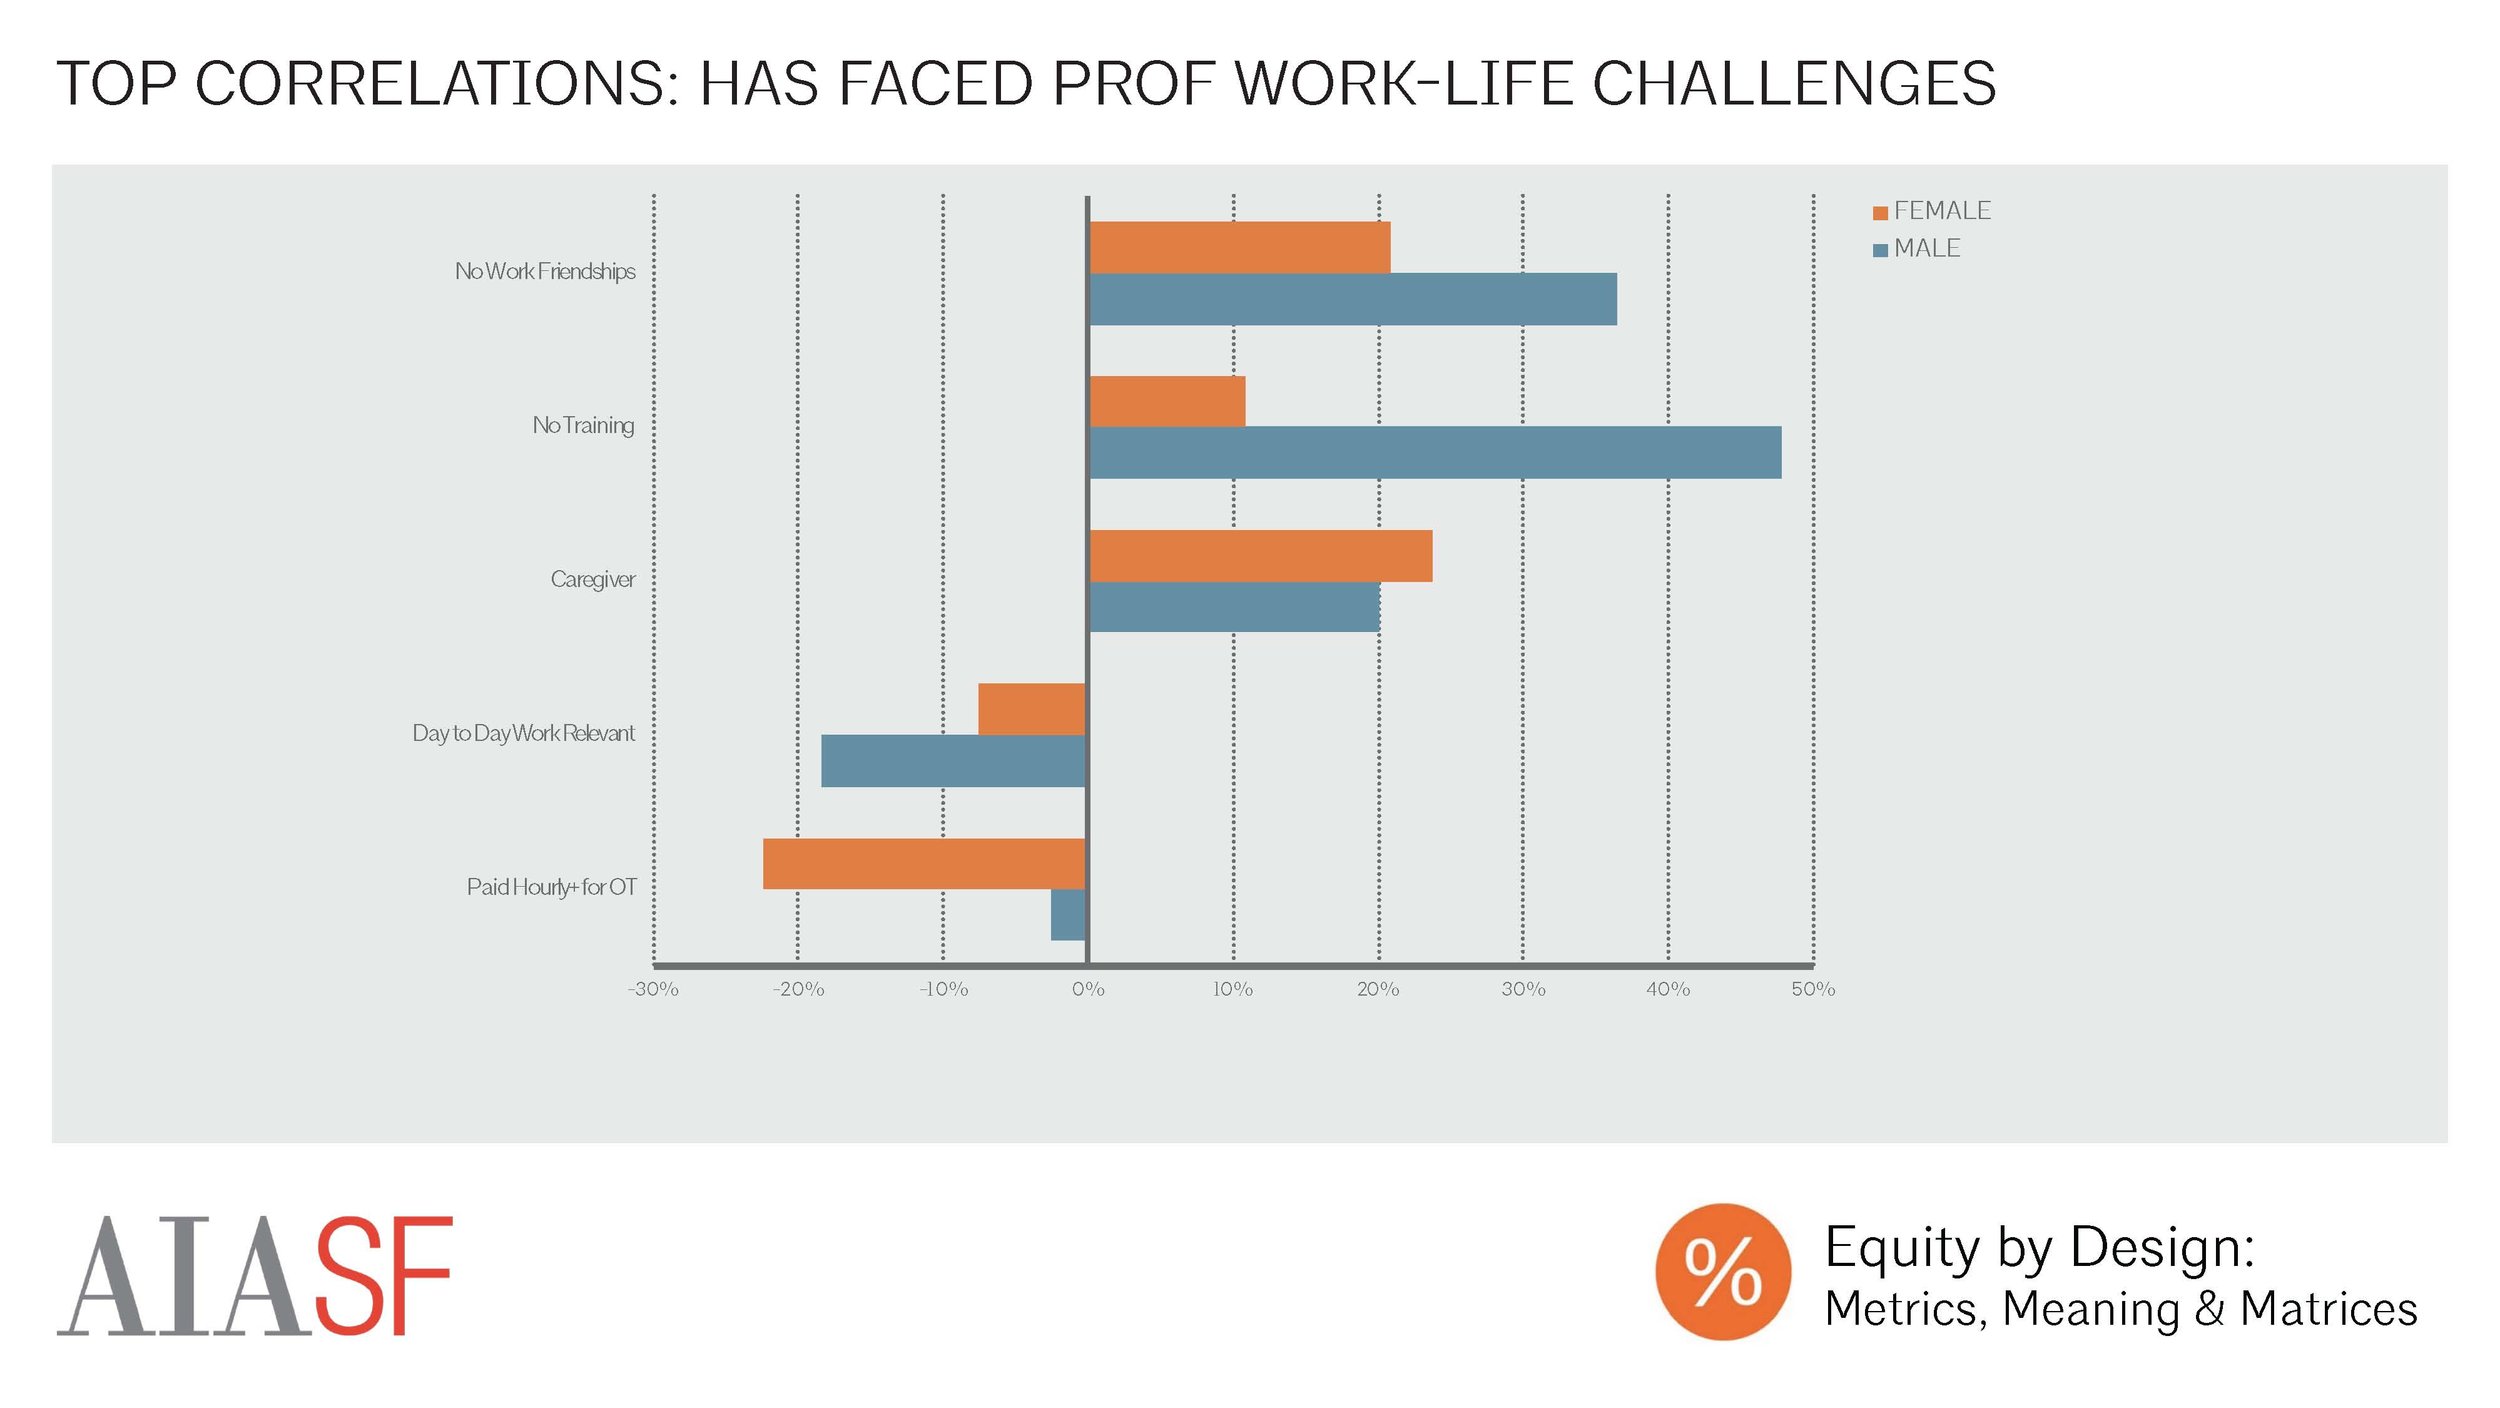
Top Correlations: Has Faced Professional Work-Life Challenges
Meanwhile, the top predictors of whether a respondent reported having made professional trade-offs in the face of work-life challenges were having no friendships at work, not receiving training for new roles, and being a caregiver. Those whose day-to-day work was relevant to their long-term goals, and those who were paid more than their hourly wage for overtime were less likely to have made personal trade-offs.

Likelihood: Has Time to Pursue Interests Outside Work by Firm Size
The size of a respondent’s firm was correlated with work-life perception, with respondents who worked in the smallest firms much more likely than those working in the largest firms to agree with the statement “I have the time and energy to pursue my interests outside of work” (55% M| 50% F in XS firms vs. 39% M| 33% F in XL firms). There were not strong correlations between firm size and whether a respondent reported having time to complete their work, exhibited signs of burnout, or had faced work-life challenges in the past.

Likelihood: Believes Work-Life "Extremely Important" by Experience Level
Experience level was a significant factor in predicting a respondent’s work-life prioritization and experiences. Those in the middle of their careers were more likely to value work-life flexibility than either those entering the field or the most seasoned professionals, with over 60% of women with 14-18 years of experience indicating that work-life considerations were “extremely important” to them.
While women placed a higher value on work-life flexibility than men at every level of experience, this gap was at its narrowest amongst those early in their careers. This is largely because because junior and mid-level male respondents valued work-life flexibility much more than their more senior counterparts. This suggests that, at least for the younger generations, work-life flexibility is an important issue for all genders.

Likelihood: Has Enough Time to Complete Work by Experience Level
While work-life flexibility was most important to those with 10-20 years of experience, this was also the career stage at which respondents were least likely to believe that their workloads were manageable. Less than half of respondents with 10-25 years of experience believes that they had enough time to complete their work.
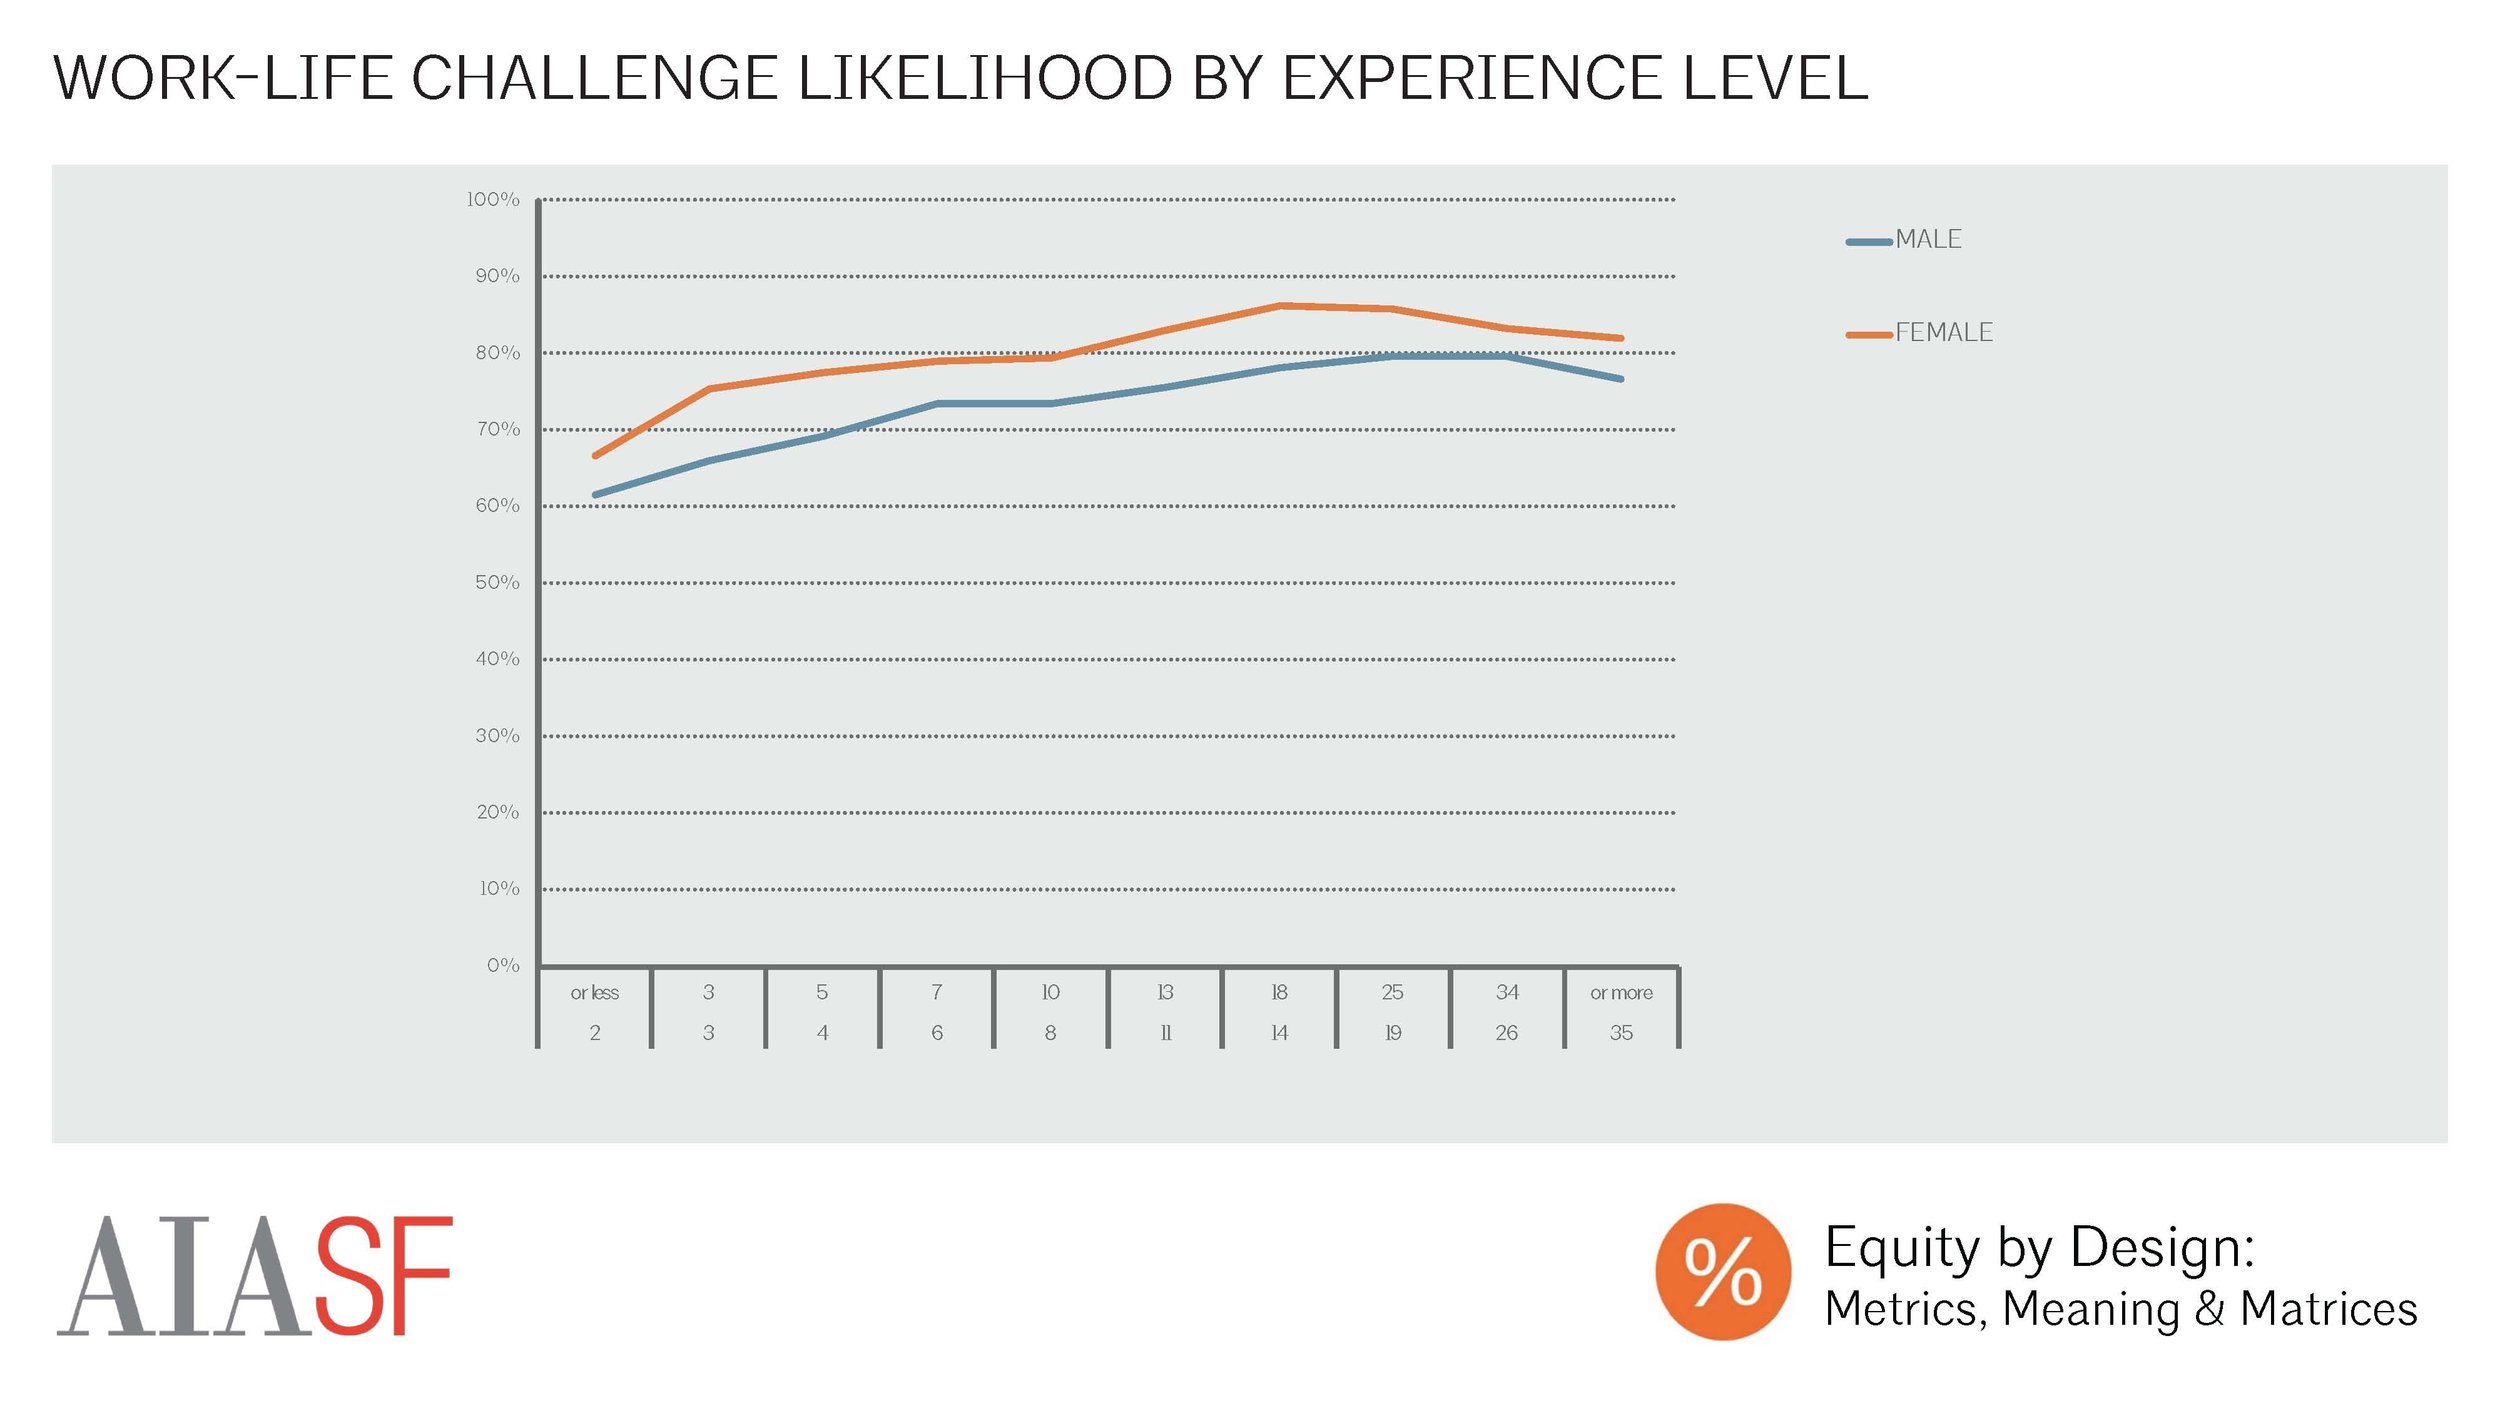
Work-Life Challenge Likelihood by Experience Level
Similarly, those with more experience were more likely than those early in their careers to report that they had faced work-life challenges in the past. Because this question asked whether a respondent had ever faced these challenges, and not whether the respondent was currently facing them, it is somewhat unsurprising that those with the longest career histories were most likely to report facing challenges. The prevalence of these challenges was, however, staggering - 79% of men, and 86% of women, with 14-25 years experience reported that they had made either personal or professional trade-offs in response to work-life challenges.
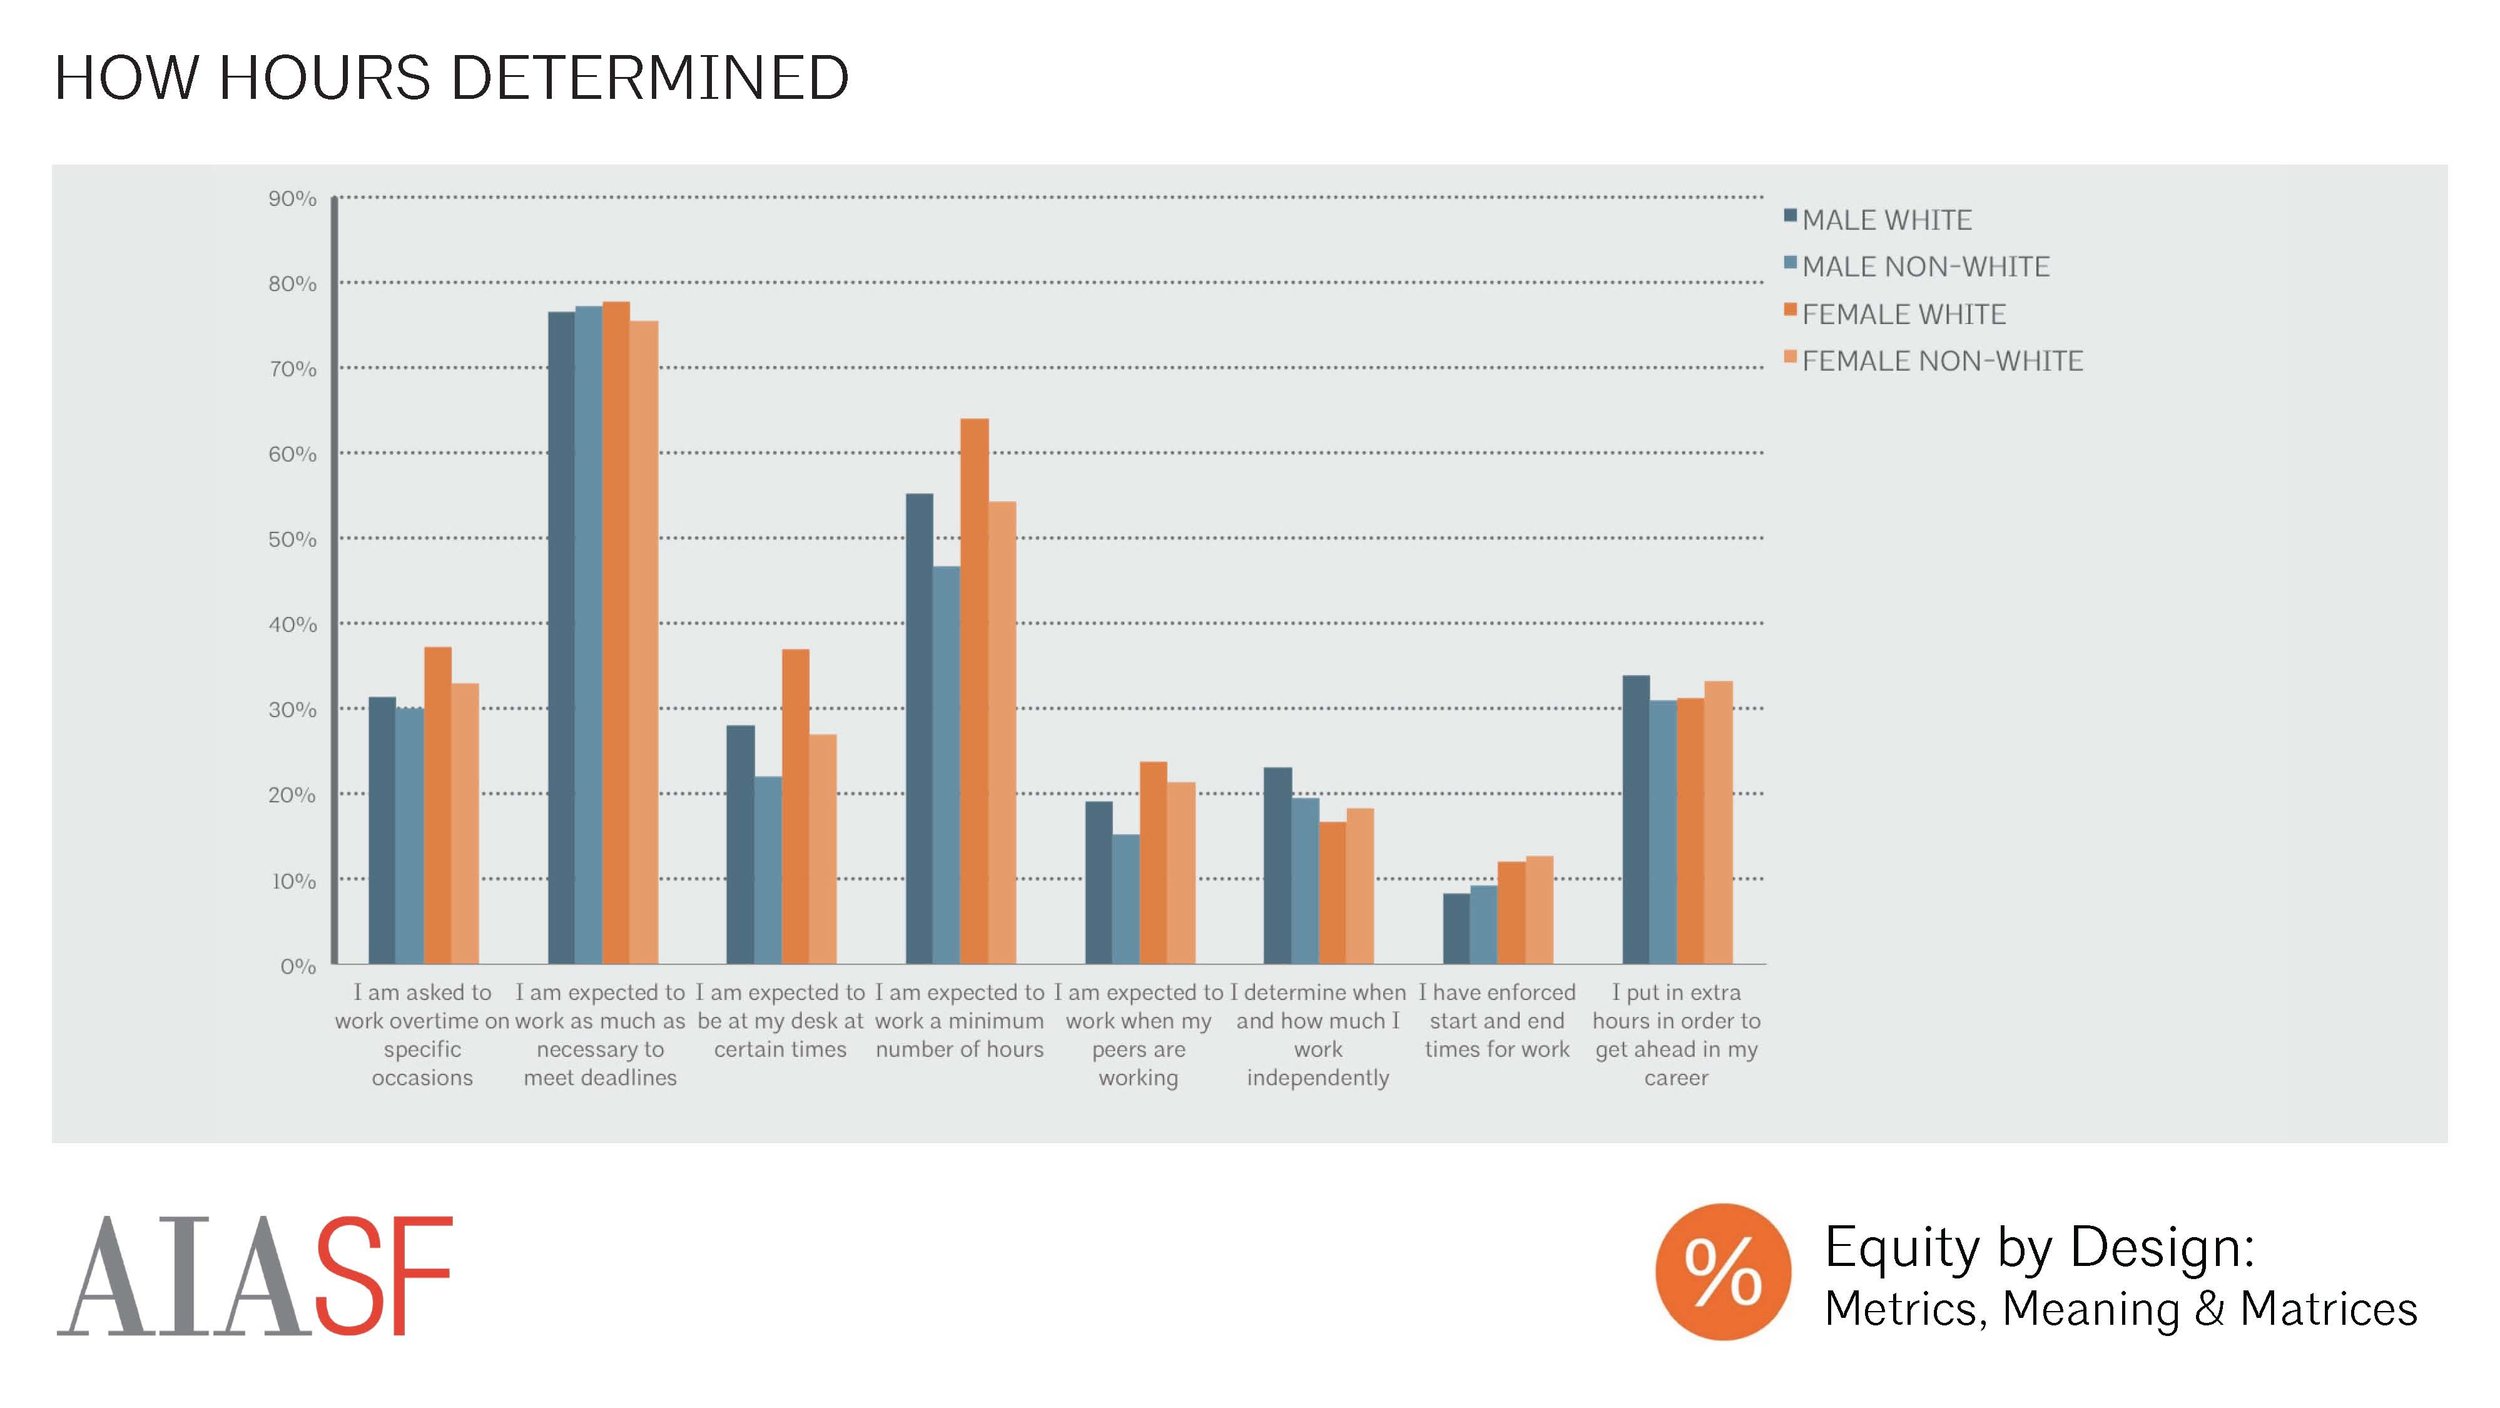
How are Your Hours Determined?
Respondents’ work schedules were determined in a variety of ways. The majority of respondents (77%) reported that they were expected to work as much as necessary to meet deadlines, suggesting that irregular schedules, with peaks in working hours around deadlines, and less hours at other times, might be the norm for architectural professionals. Compared to those whose hours were determined in another way, those who reported that they were expected to put in as many hours as necessary to meet deadlines were 12% less likely (-12% M | -13% F) to believe that they had time to pursue their interests outside of work, 11% less likely to believe that they had enough time to complete their work (-12% M | -10% F), and 13% more likely to have faced work-life challenges (16% M | 11% F).

How are You Compensated for Overtime Work?
While potentially long hours were expected of most respondents as needed to meet deadlines, few received compensation for overtime work. Overall, 59% of practitioners reported that they were not compensated in any way for overtime work. White men were least likely to be compensated for overtime work, potentially because white male respondents were more experienced on average, and were more likely to be salaried (vs. hourly) employees. Of those who were offered compensation for overtime work, comp time, or regular business hours off in exchange for overtime hours worked, was the most common form of compensation. Only 23% of respondents received monetary compensation, whether in their paycheck or through a bonus, for overtime work.

Access to Work-Life Benefits
According to respondents, firms are offering a variety of benefits and policies intended to to promote work-life flexibility. Most respondents reported that they had flexibility in terms of start and end times for work (“core hours”), and firm-provided technology to support working from home. Other common work-life benefits included the ability to work from home during normal business hours, comp time (time off in exchange for overtime hours worked), part time schedules, and a compressed schedule (40+ hours/week, with more than 8 hours on some days of the week, and a regularly scheduled full, or partial day off). White male respondents were more likely than women and people of color to report having access to every one of these work-life benefits.
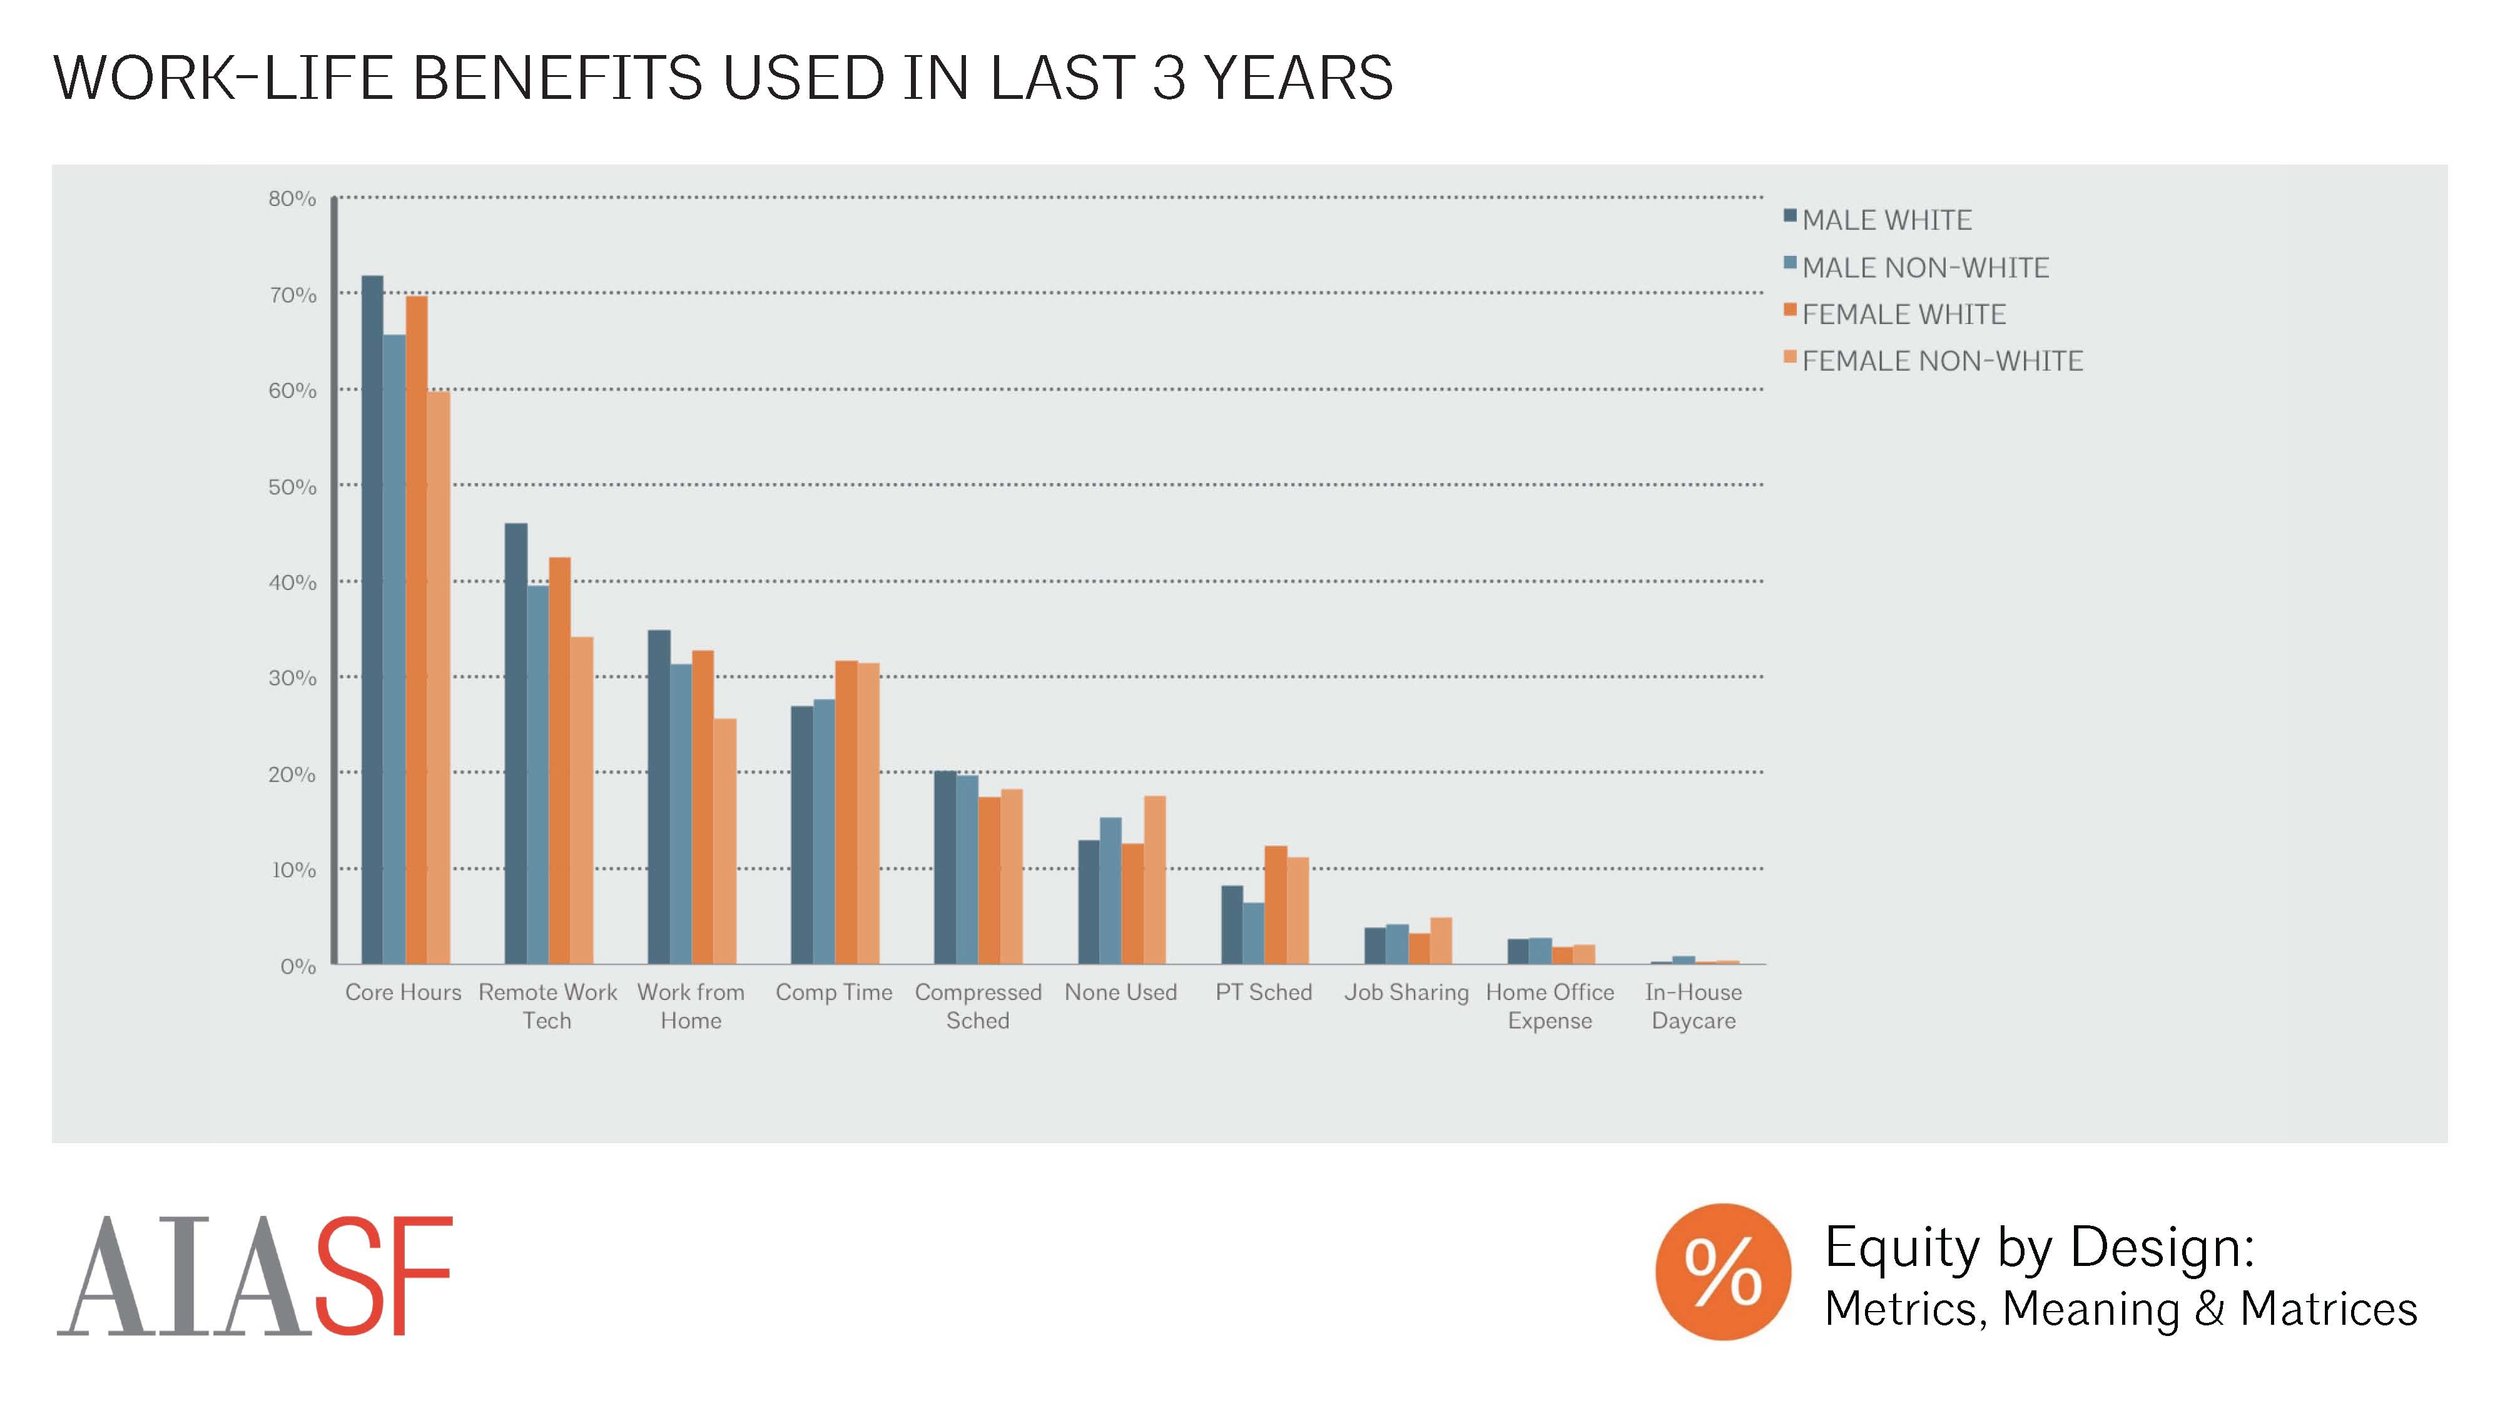
Work-Life Benefits Used in Last 3 Years
The vast majority of respondents reported that they had used work-life benefits within the last three years, but there was a great deal of variety in terms of which work-life benefits respondents reported using. White males were also more likely than others to report using the three most commonly offered work-life flexibility benefits (core hours, technology to support remote work, and working from home). People of color were less likely than white respondents to report using each of the most common benefits. Female respondents, meanwhile, were more likely than male respondents to use comp time.
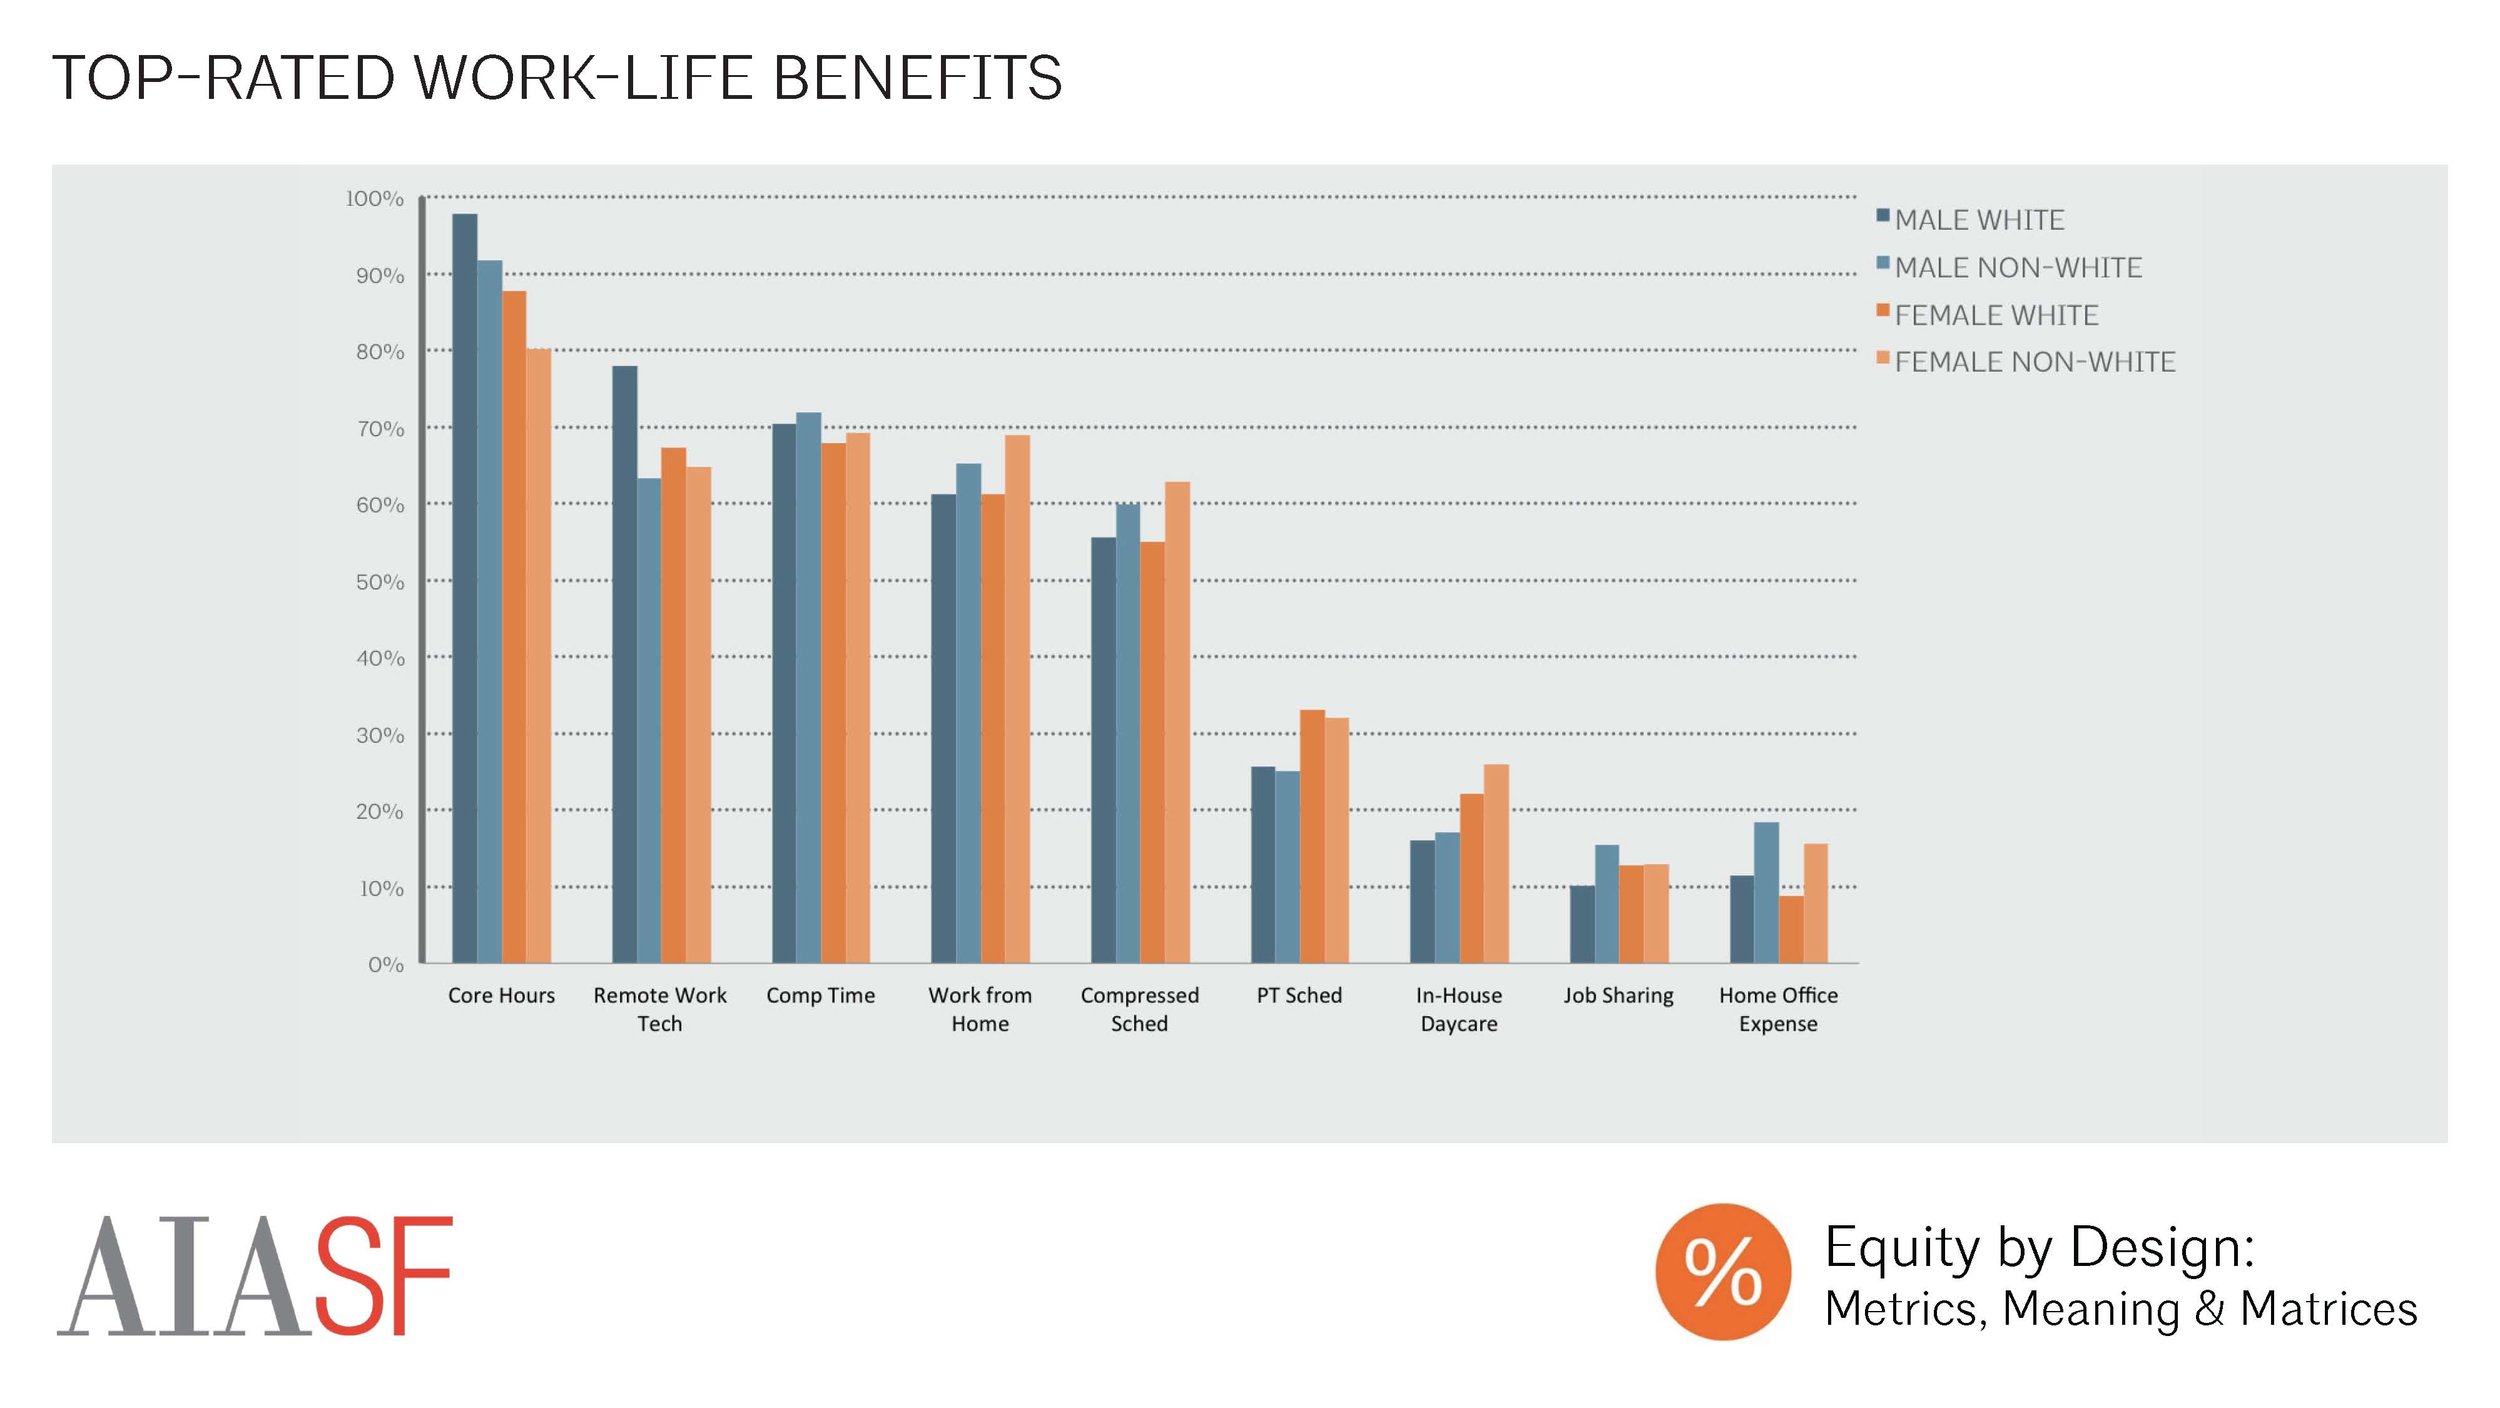
Top-Rated Work-Life Benefits
When asked which benefits were most helpful in promoting work-life flexibility, the most common responses were: “core hours,” “technology to support remote work,” and “comp time.” in other words, respondents most likely to value benefits that offered them flexibility in terms of where and when they worked, rather than benefits that allowed them to work less hours overall.
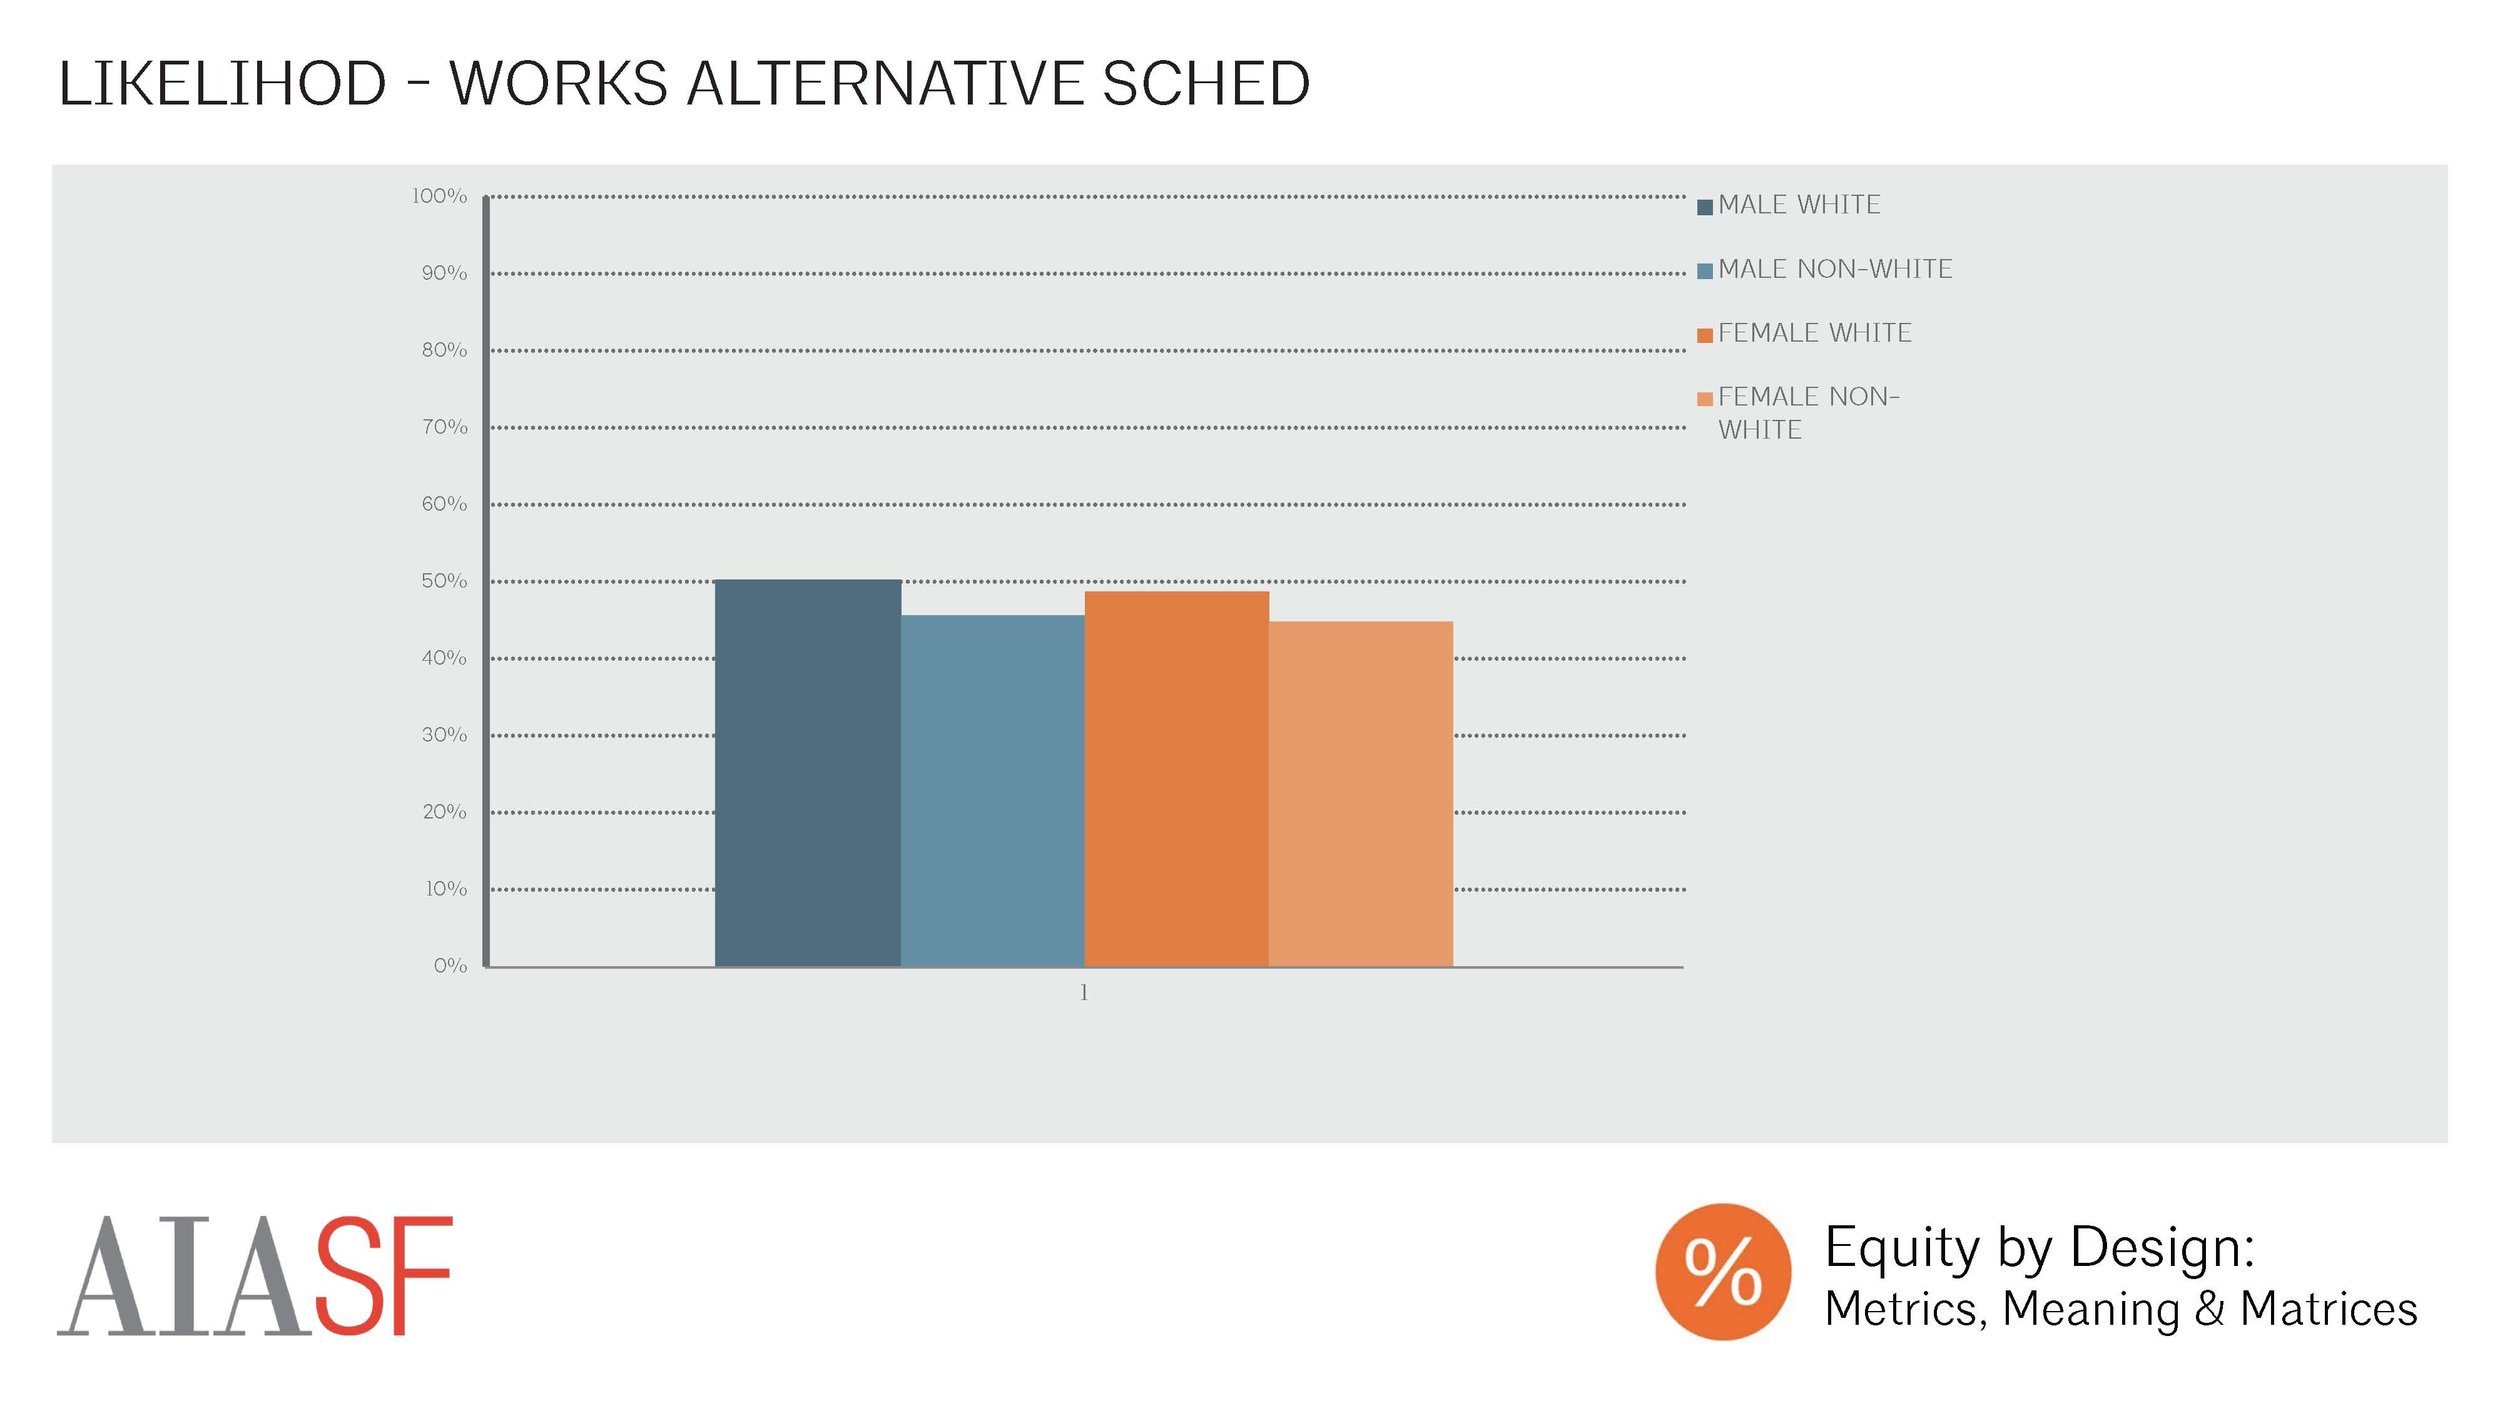
Likelihood - Works an Alternative Schedule
Overall, 49% of respondents reported having worked some kind of alternative schedule over the last 3 years. For the purposes of our analysis, the following types of schedule were considered “alternative”: compressed (40 hours/week, with some days longer than 8 hours, and some days with fewer or no hours), telecommuting (working from home during regular business hours), part time (less than 40 hours per week), and job sharing (two or more people work part time hours to do the equivalent of one full-time employee’s workload). There wasn’t much variation in likelihood of working an alternative schedule, but white men were actually slightly more likely than other respondents to have worked an alternative schedule. The most common type of alternative schedule was working from home, while job sharing was the least common.

Top Reasons for Working Alternative Schedule
The most common reasons that respondents reported working alternative schedules were overall flexibility, increased productivity, and to pursue personal interests. Female respondents were more likely than male respondents to report working an alternative schedule in order to provide childcare.

Works Alternative Schedule: Perceived Impacts
Overall, most respondents who worked an alternative schedule reported that the schedule hadn’t had any adverse impacts on their career. White men were least likely to report adverse impacts, while non-white men, white women, and non-white women were each successively more likely to report adverse impacts.
The most commonly reported adverse impact was a belief that co-workers perceived alternative schedule users as less committed to their careers. Women who had worked alternative schedules were twice as likely as men who worked these schedules to report this adverse impact.

Part-Time Work: Perceived Impacts
Respondents’ perceptions of the ways in which their alternative schedules had impacted their careers varied by alternative schedule type. Part-time schedules were associated with the highest probability of believing that one’s schedule had adversely impacted one’s career, with less than half of respondents reporting no impacts. Women were much more likely than men to report being adversely impacted by their schedules (65 % of men reported no impacts vs. 36% of women). The most common reported impact of working part time was a reduced rate of compensation.

Likelihood: Spent a Month of More Away from Architecture
Amongst our respondents working in firms, we found that it was relatively rare to have taken off a month or more in the past, either by taking a leave of absence, or by leaving a job entirely.

Desire for Time Away
However, amongst those who had never taken this time off, we found that only 31% of our male respondents, and just 19% of our female respondents had never wanted to do so, and didn’t anticipate wanting to take a month or more off in the future. With so many practitioners hoping to take time away from a job in architecture, employers would do well to consider sabbatical or leave of absence programs.
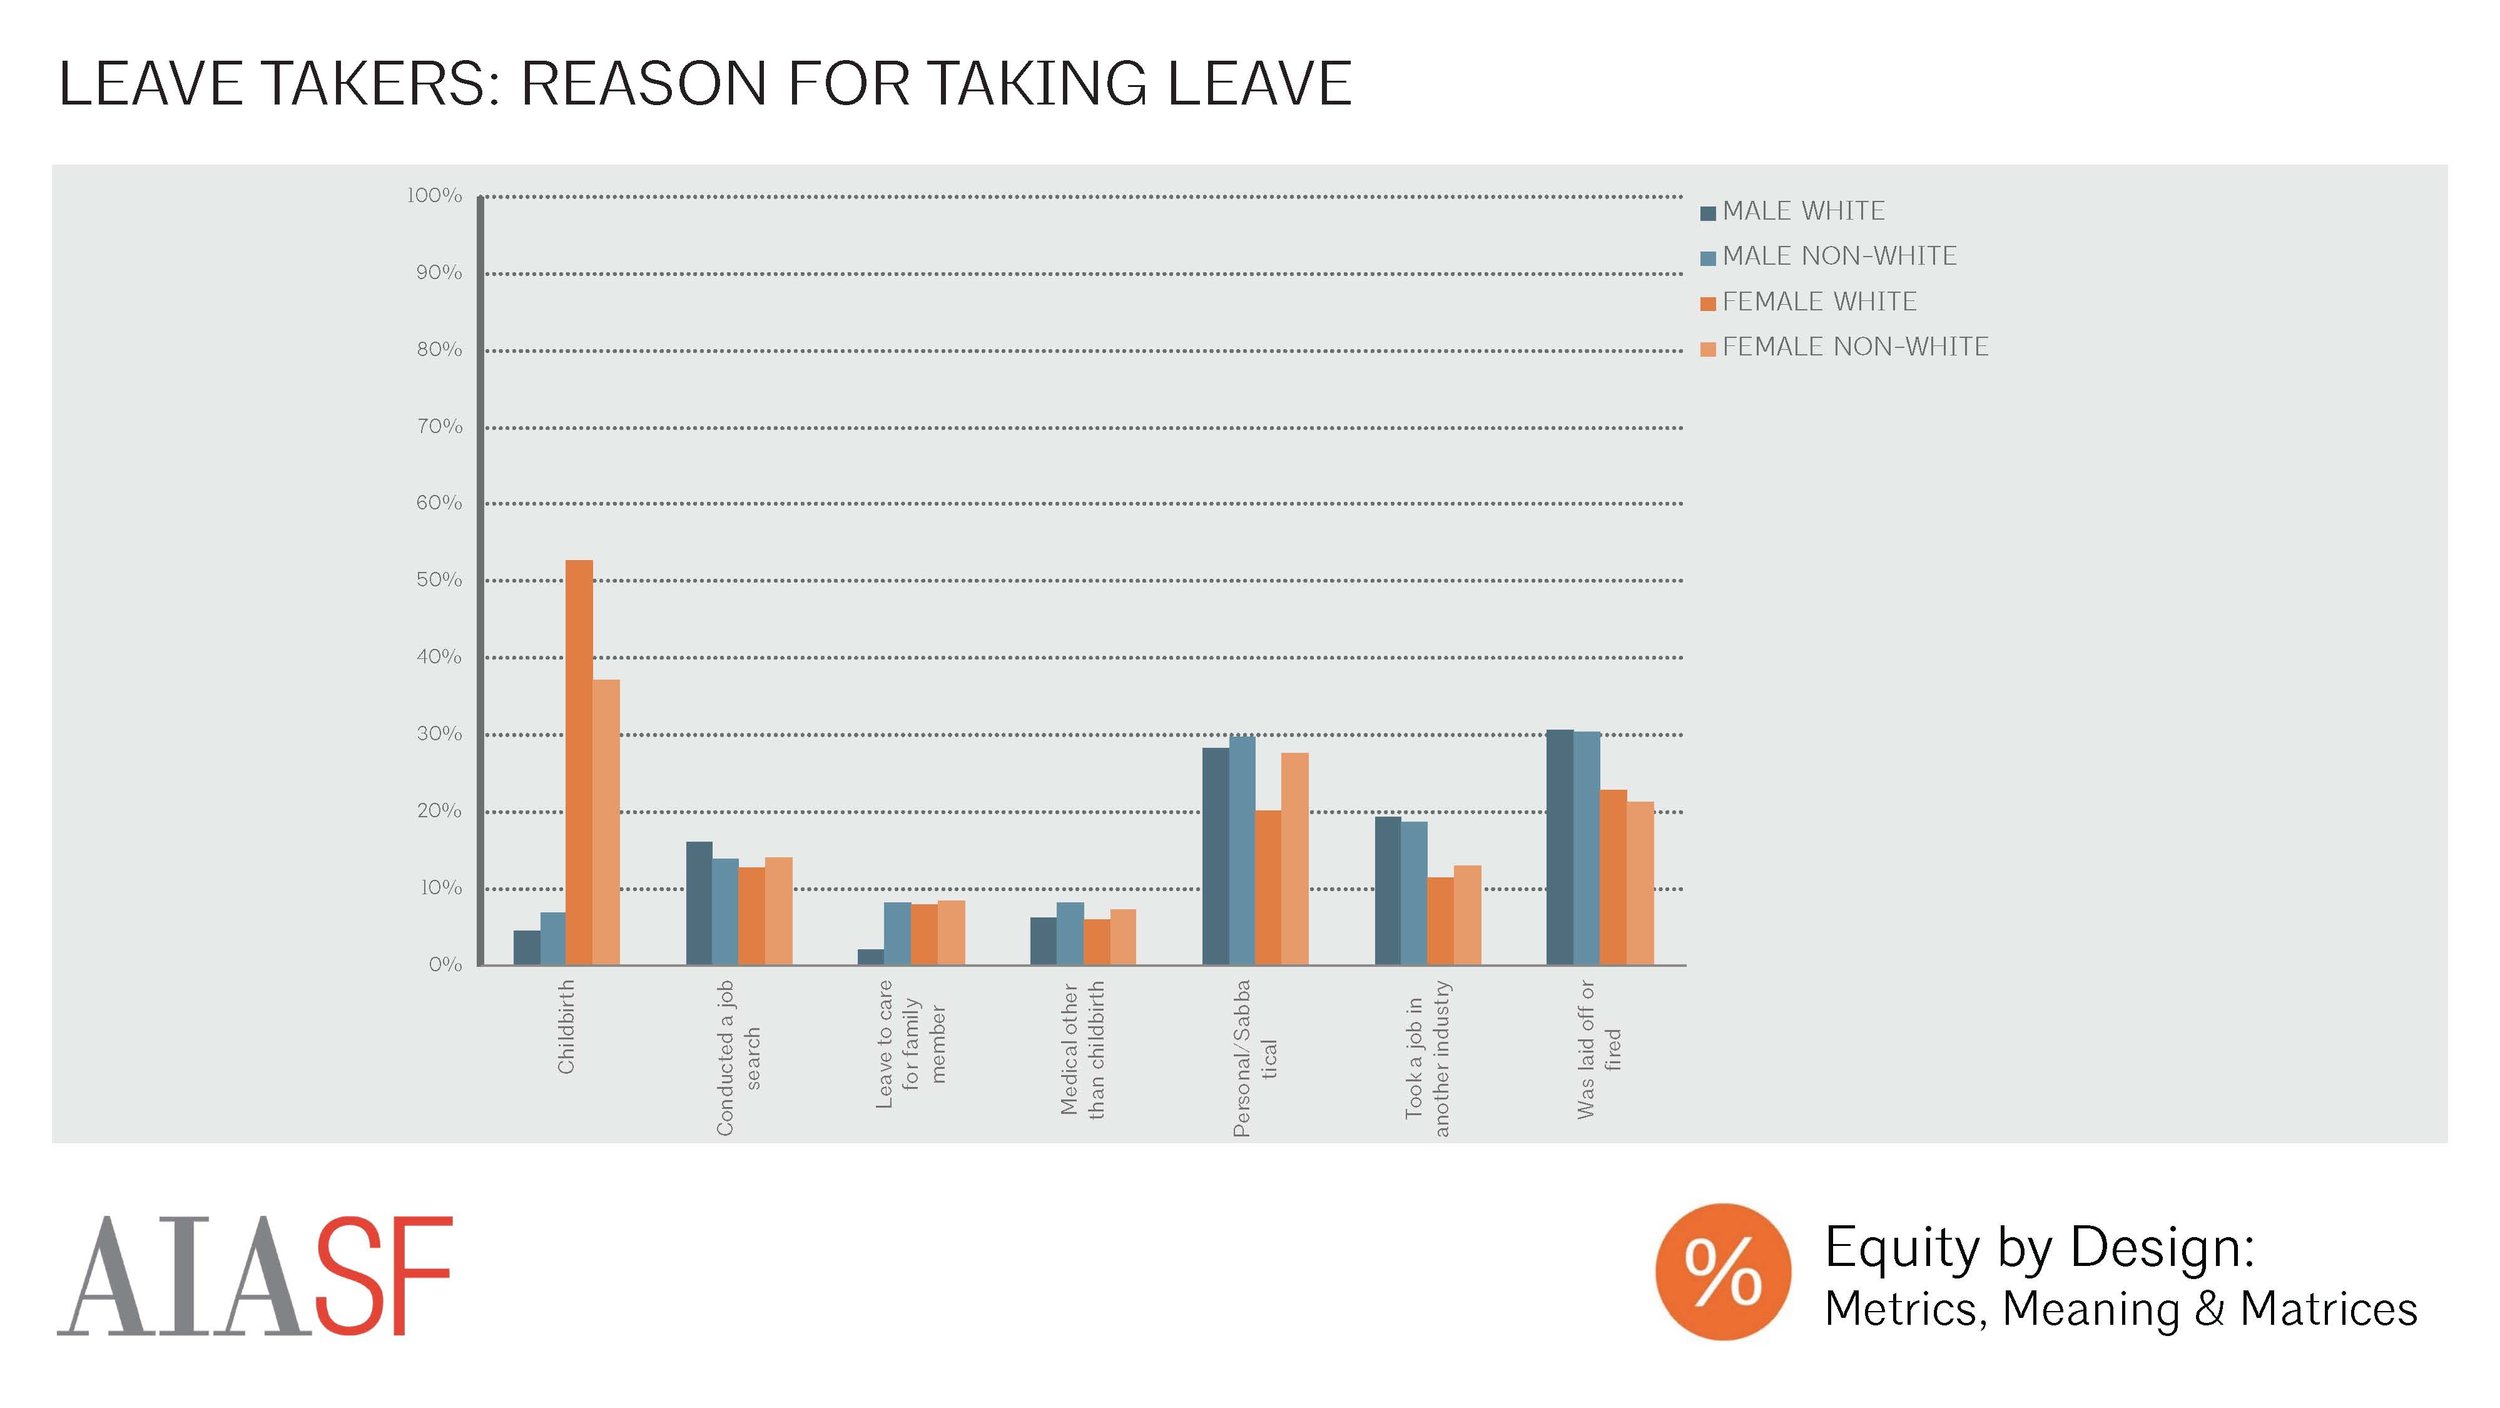
Leave Takers: Reason for Taking Leave
Amongst those who had taken a leave, the most common reasons were childbirth, having been laid off, and taking a personal leave or sabbatical. Women were much more likely to have taken a leave for childbirth, with 53% of white female leave-takers, 37% of non-white female leave-takers, 7% of non-white leave-takers, and 5% of white leave-takers reporting taking a month or more for childbirth.
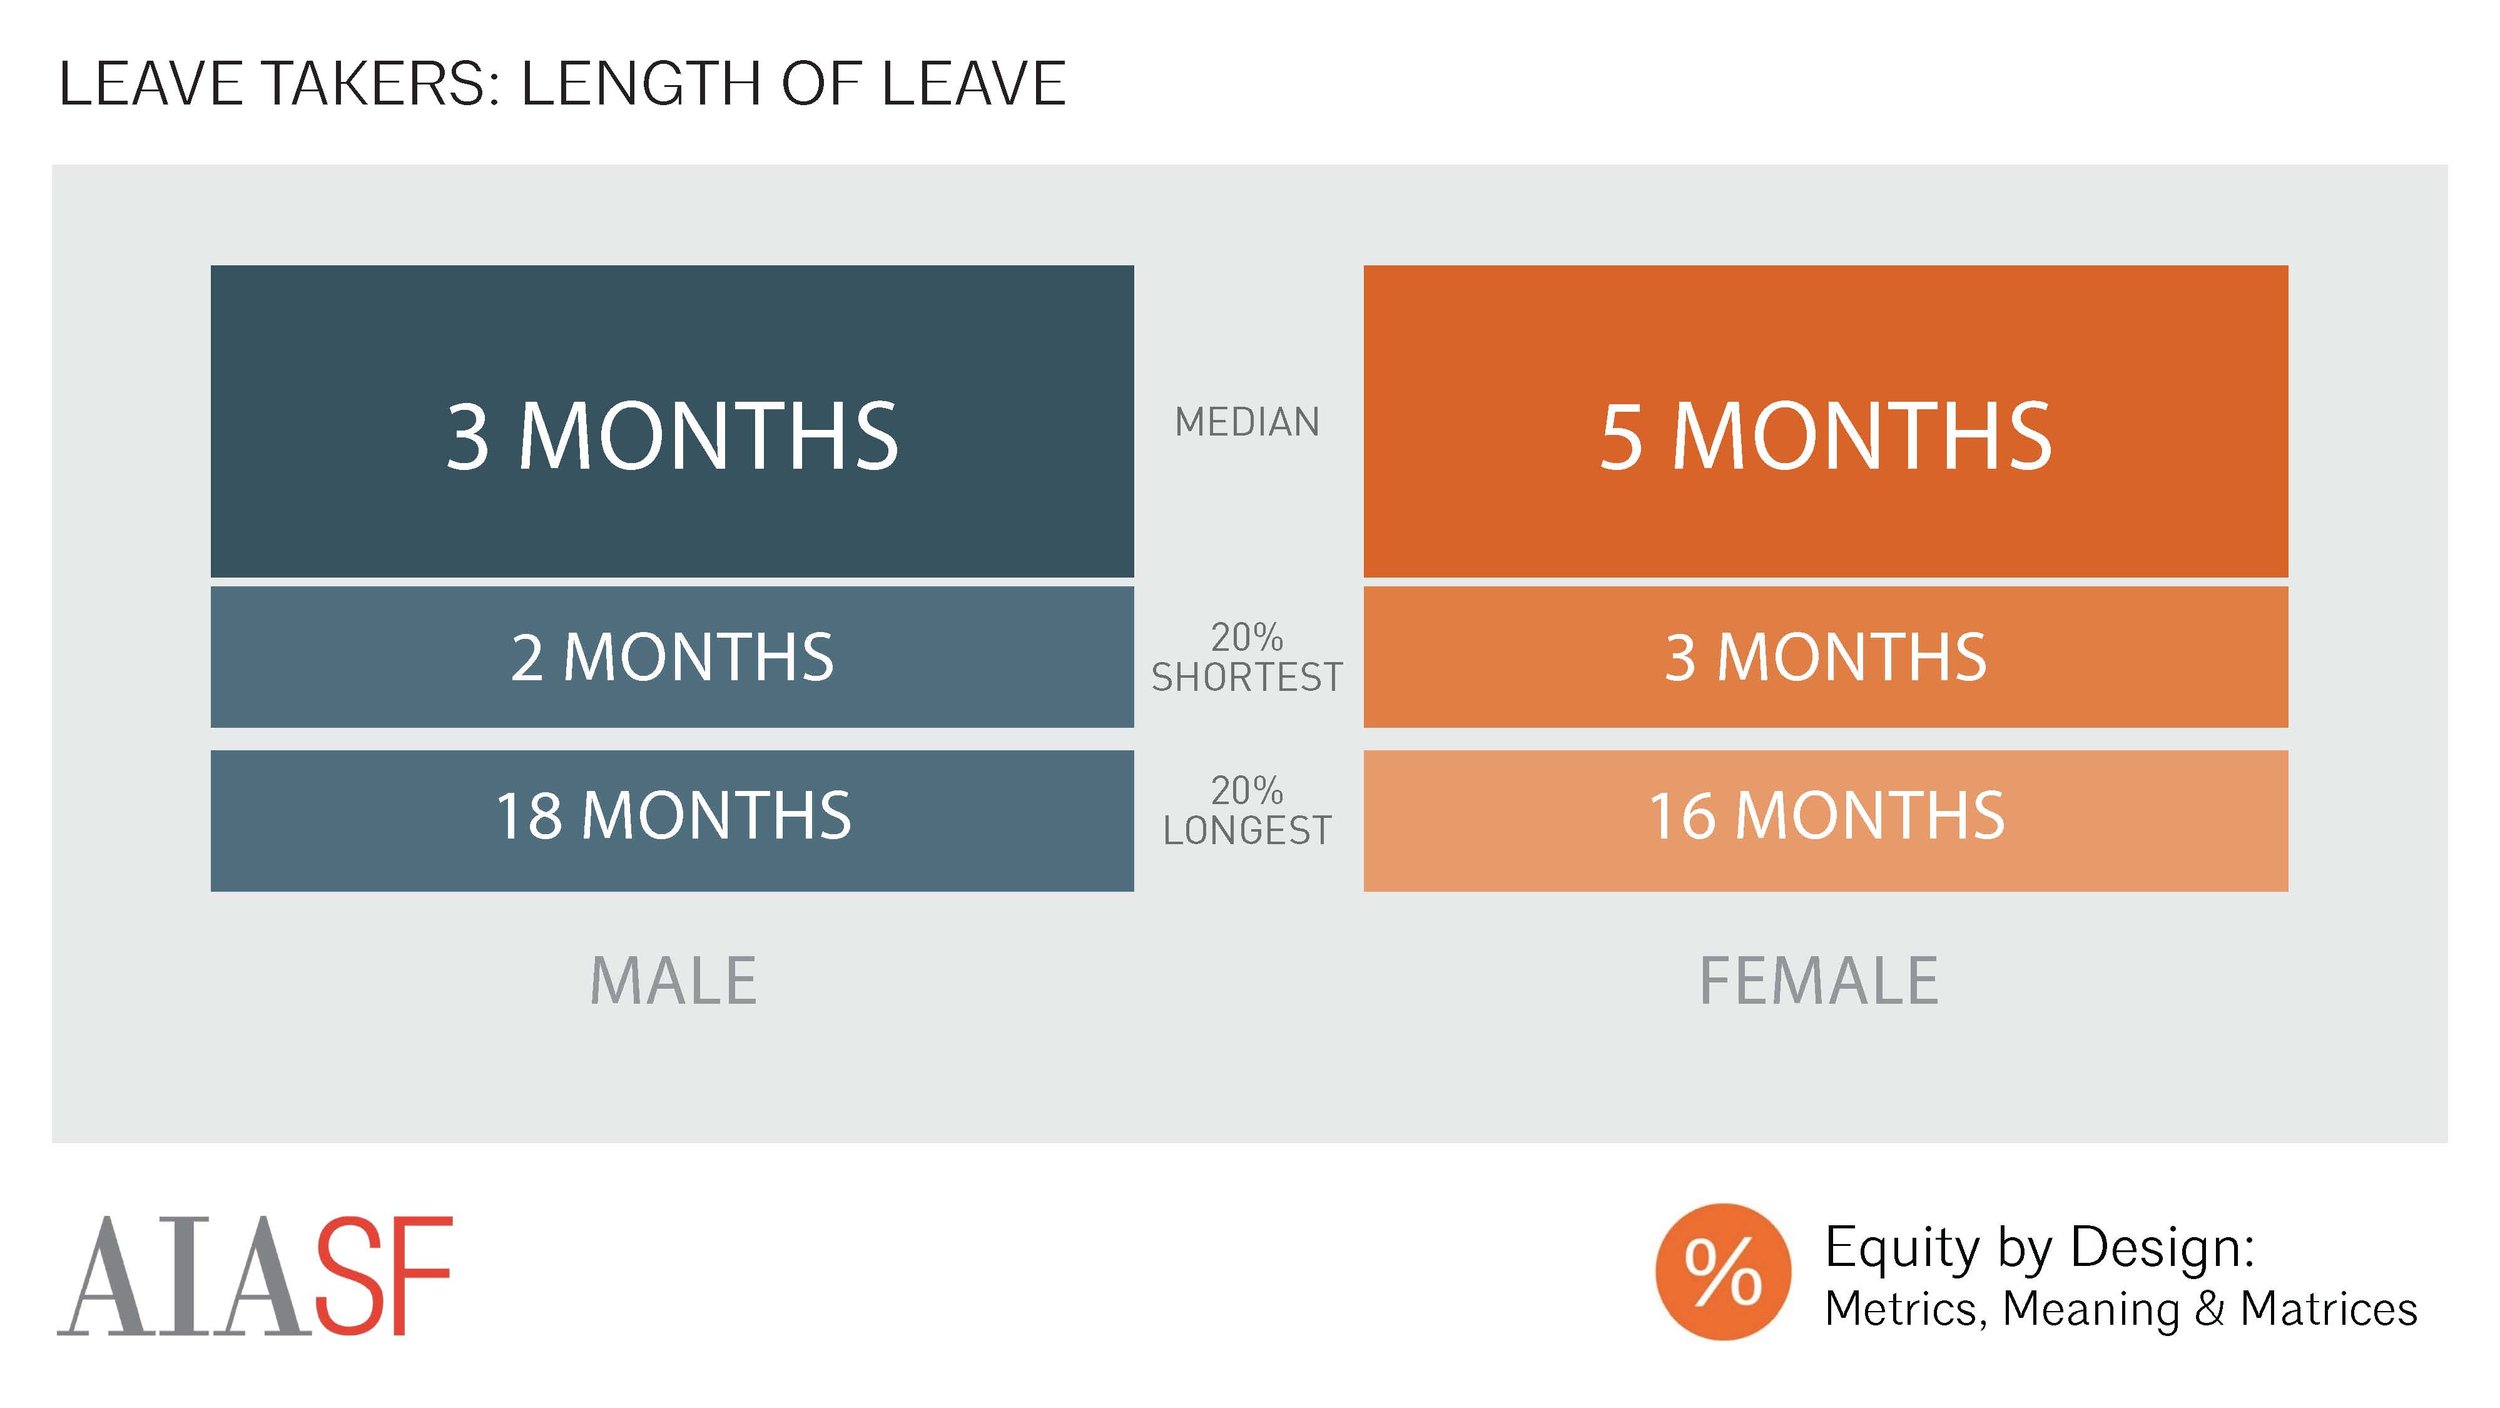
Leave Takers: Length of Leave
There was considerable variation in the amount of time that leave-takers spent away from the field, with a 20th percentile leave length of 2 months, a median leave-length of 5 months, and an 80th percentile leave length of 18 months. Male respondents took slightly shorter leaves, on average, than female respondents.

Leave Takers - Perceived Impacts
White male leave-takers were much more likely than women and people of color to report that their leaves had caused no adverse impacts on their careers (59% of White Males | 52% Non-White Males | 43% White Females | 41% Non-White Females). The most commonly reported adverse impacts were delayed advancement or promotion and reduced rates of compensation.
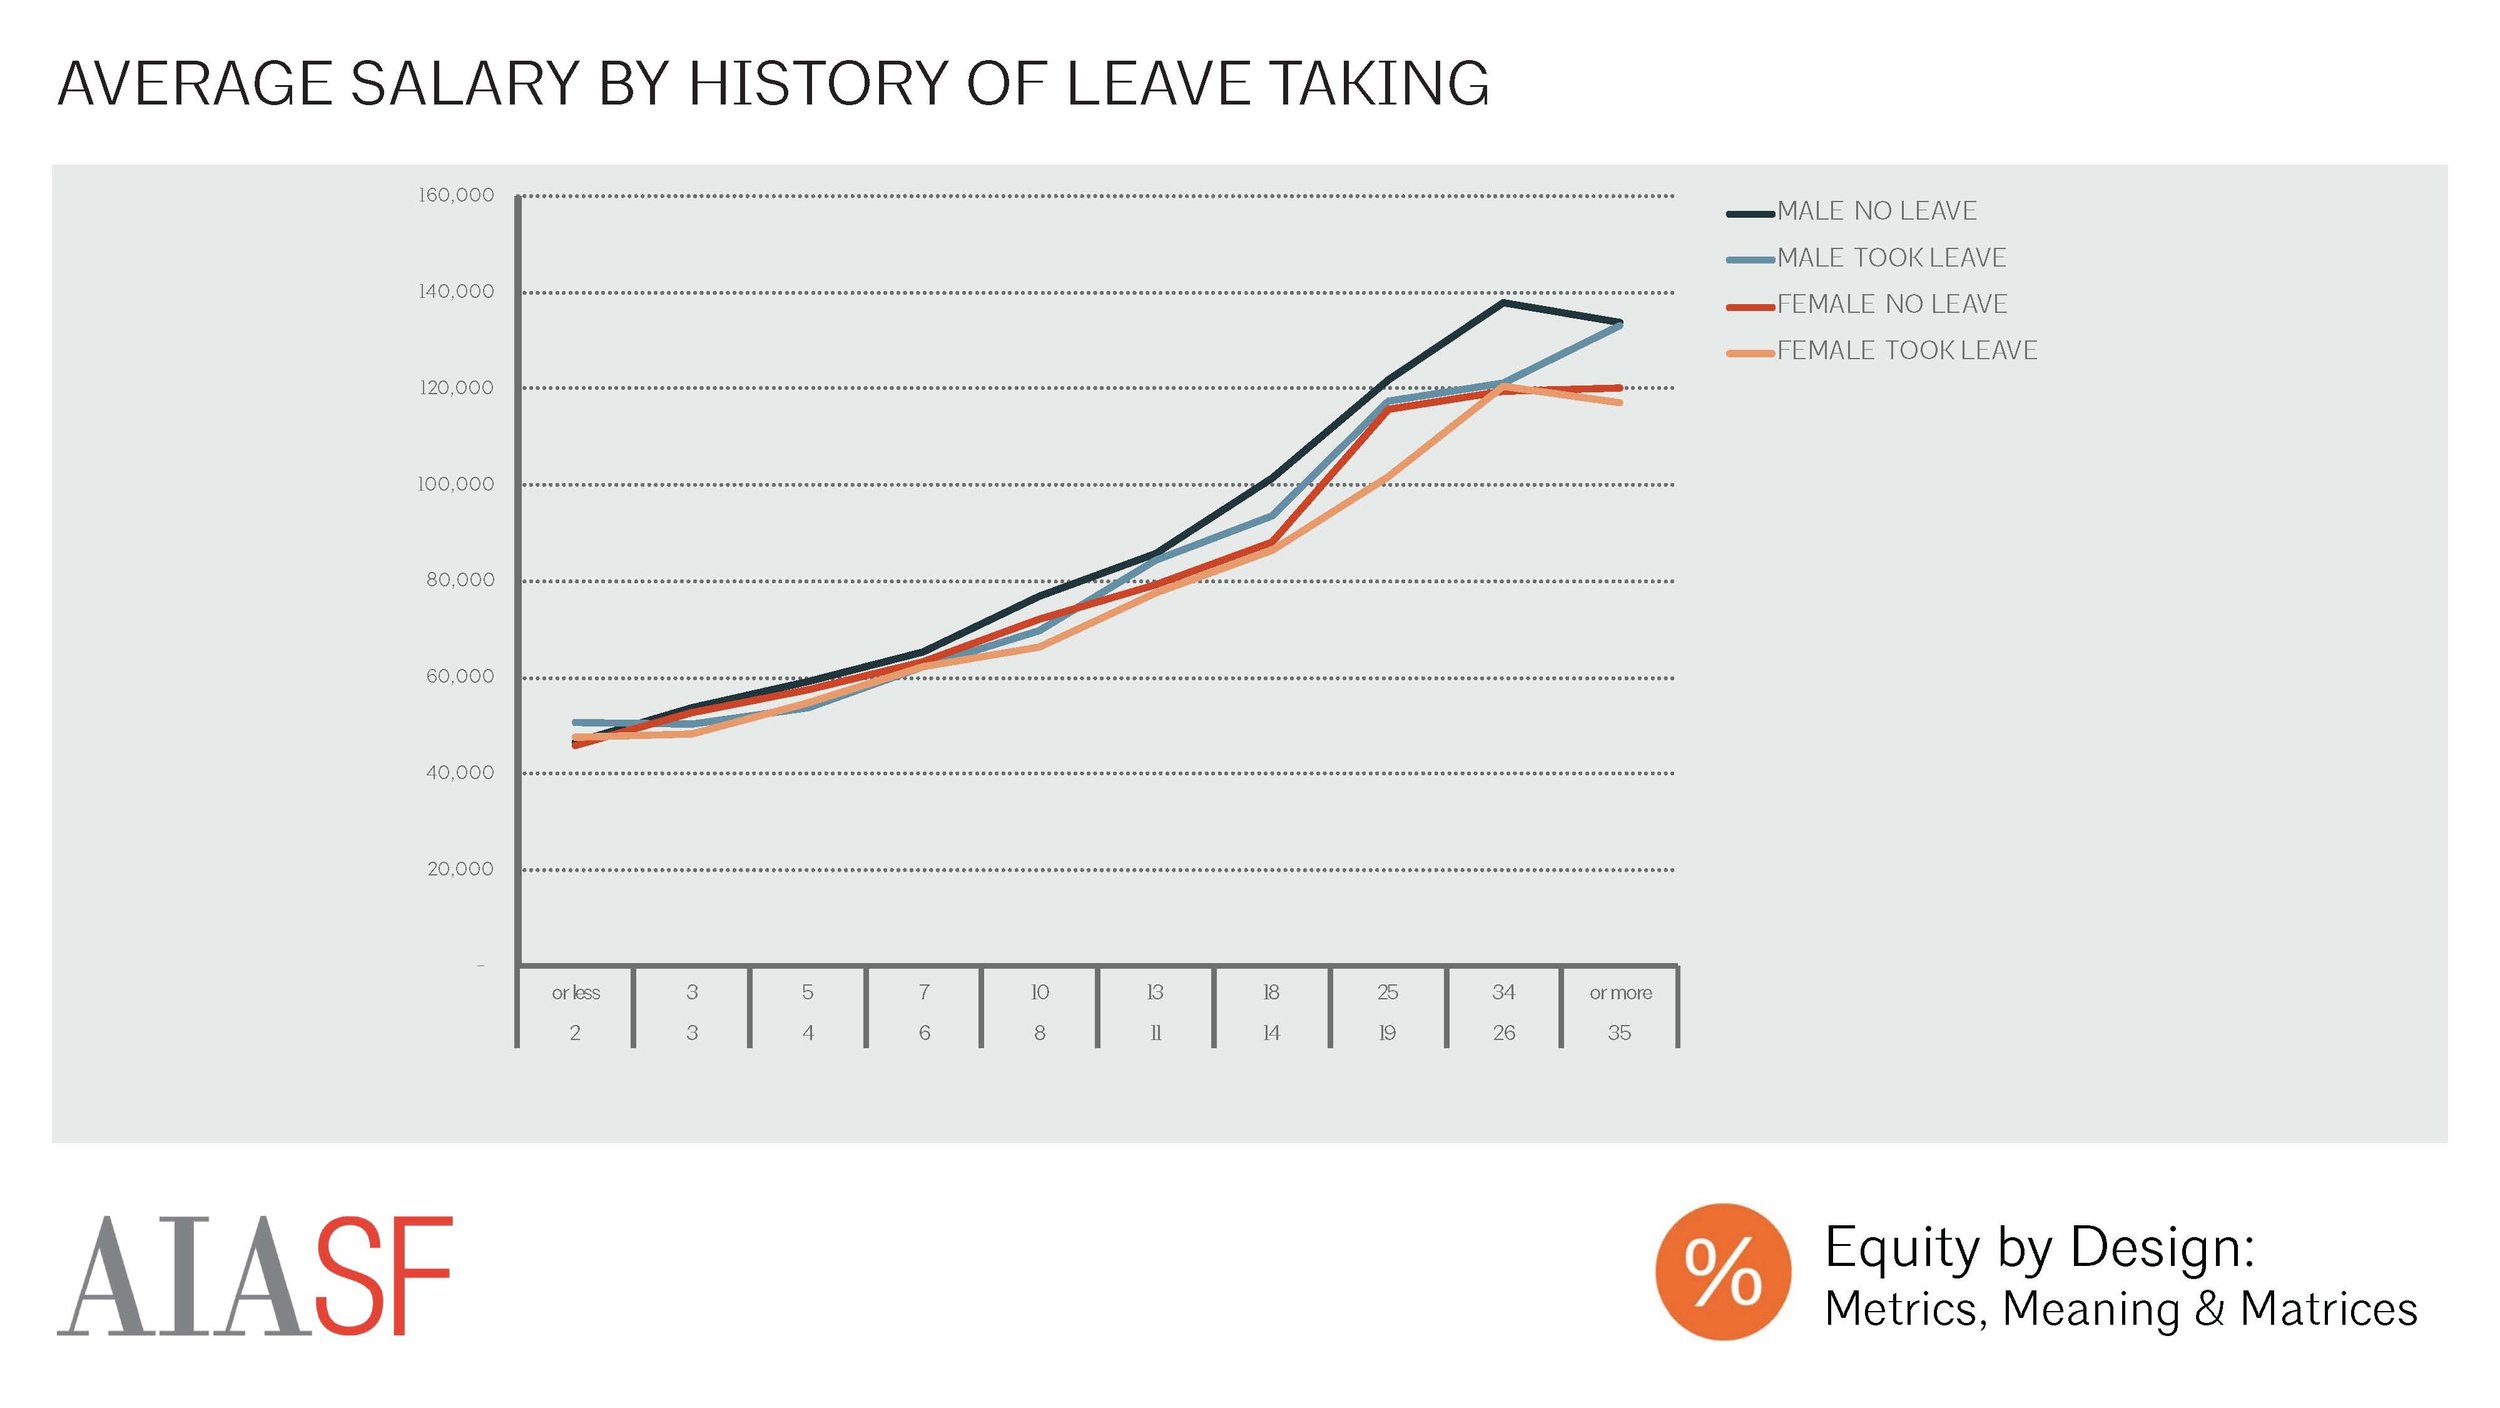
Average Salary by History of Leave Taking
A history of leave-taking was also correlated with measures of professional success like salary and compensation. Men who had taken a leave in the past made less, on average, than those who had never taken time away. Similarly, women who had never taken a leave in the past made more on average than those who had taken a leave.

Likelihood of being Principal/Partner by Leave History
Meanwhile, women who had never taken a leave were much less likely than leave-takers at nearly every level of experience to be a principal or partner. Amongst those with more than 13 years of experience, men who had never taken a leave were more likely to hold these leadership positions.

Career Perceptions by History of Leave Taking
There were no significant differences in career perceptions amongst leave-takers and those who had never taken a leave.
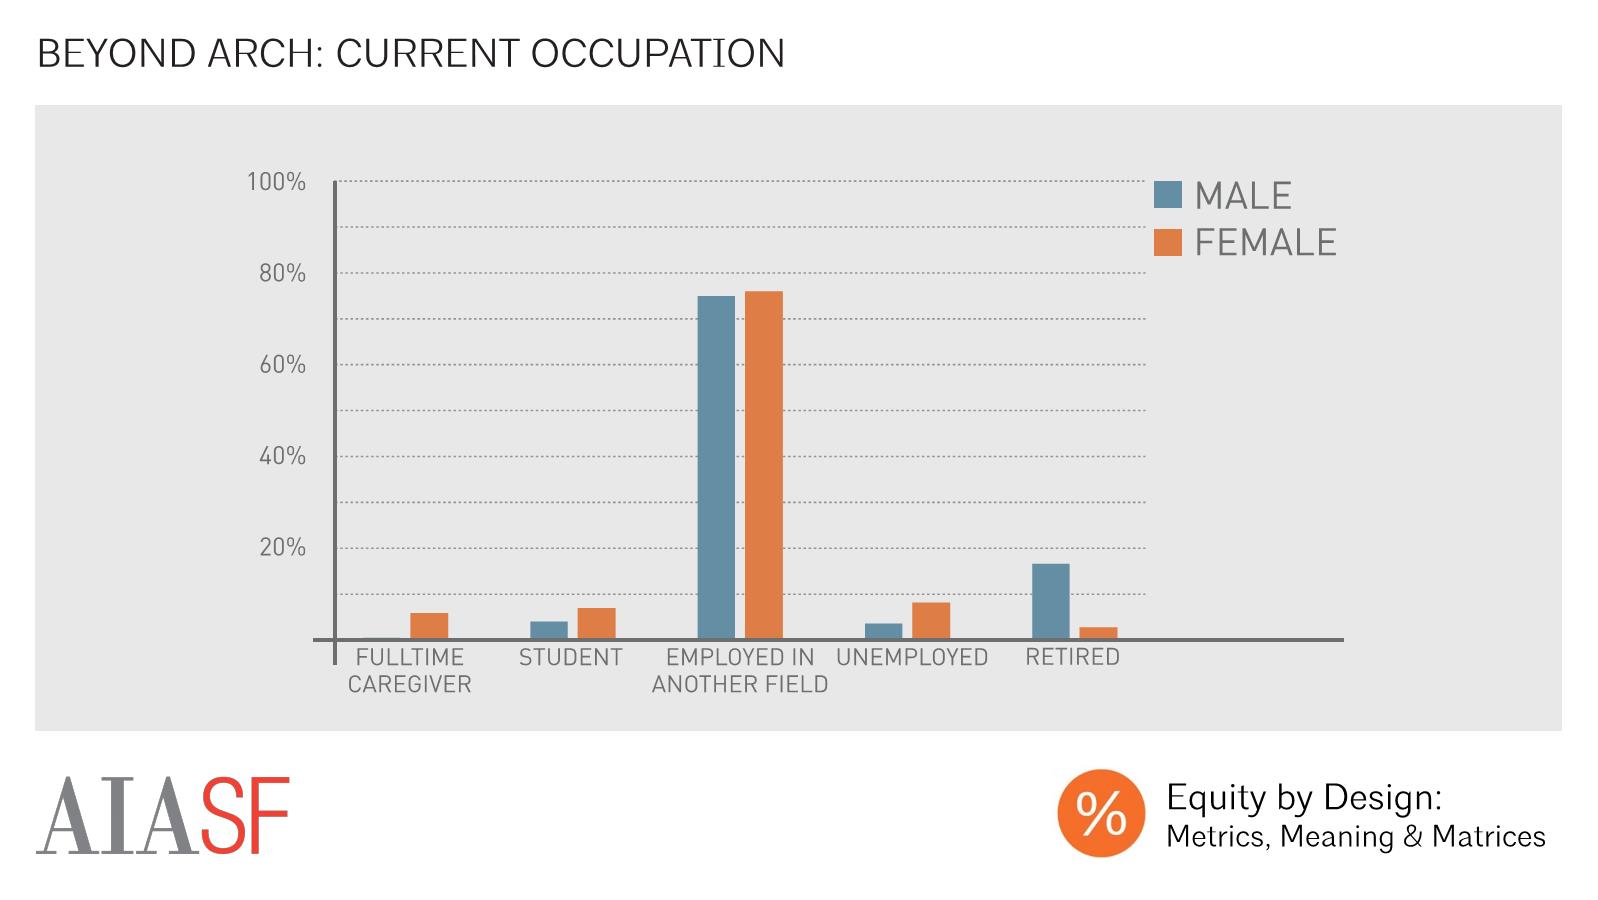
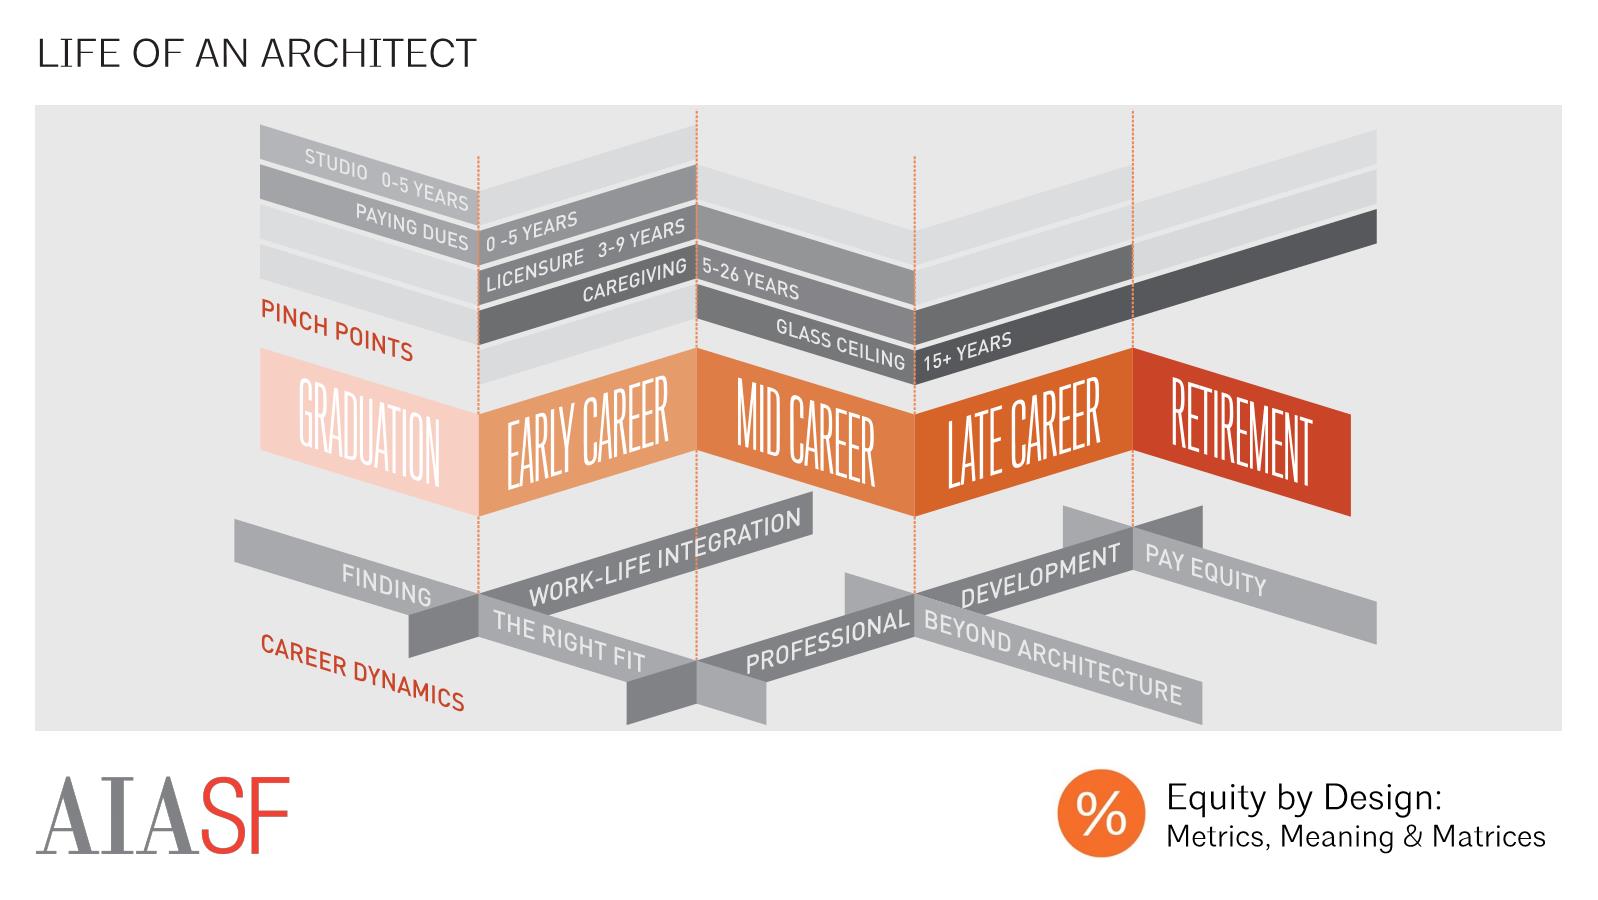
The last career dynamic, Beyond architecture, tracks individuals who are currently working in settings other than firms or sole proprietorships, as well as full-time caregivers and those who are unemployed. We also consider those who have spent time away from a firm or sole proprietorship in the past, whether to pursue another career opportunity, or to take a sabbatical or leave of absence.
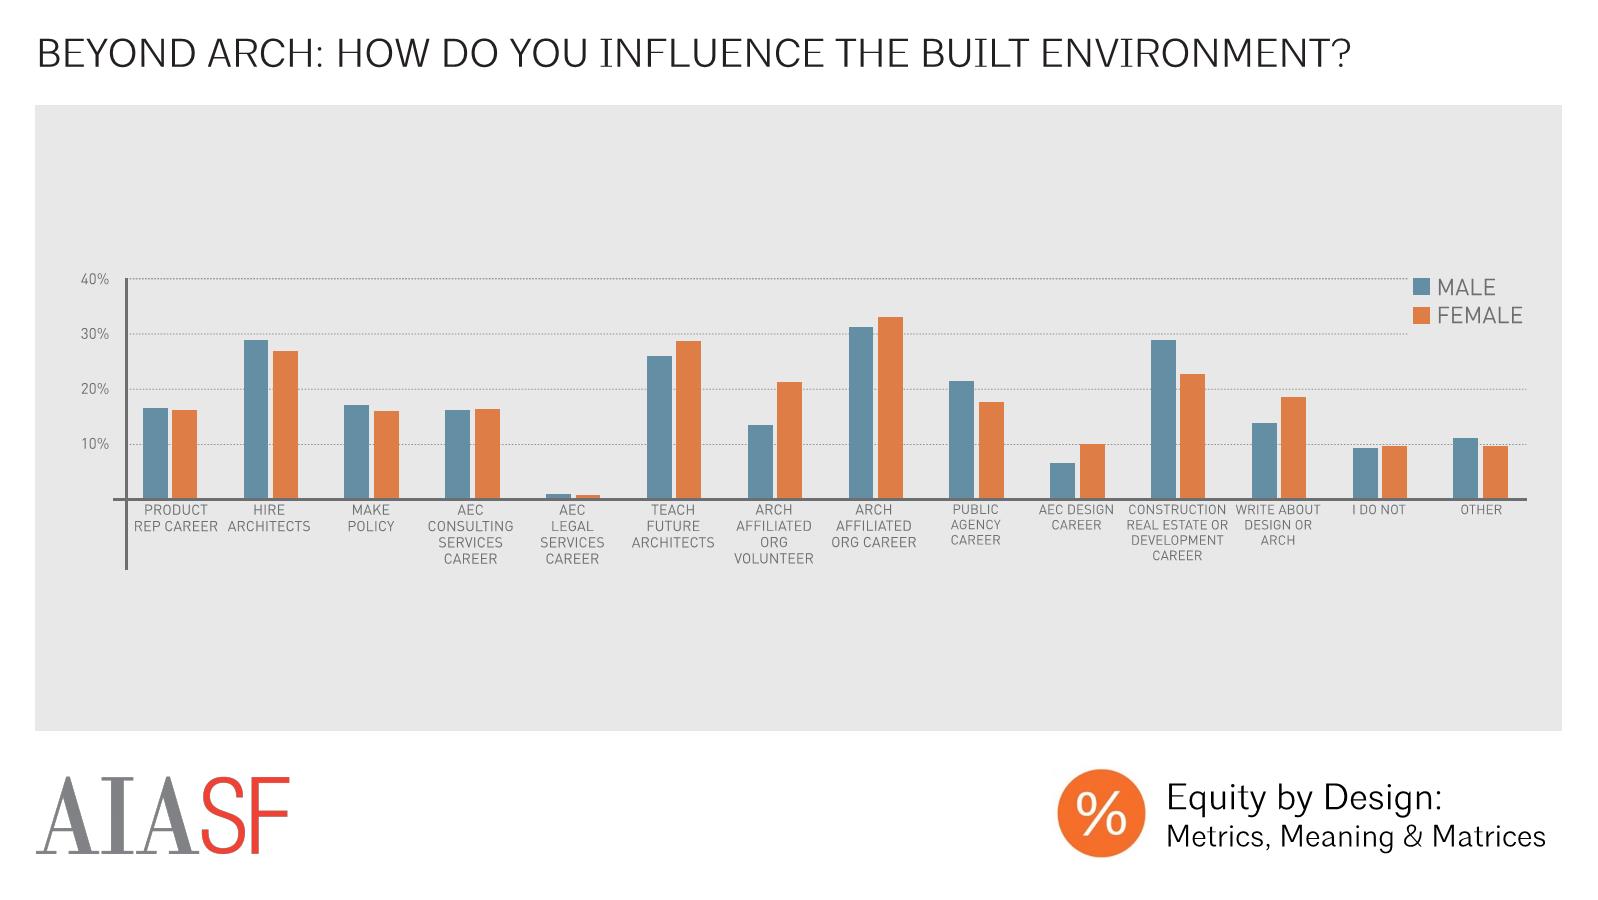
Overall, 17% of our male respondents, and 18% of our female respondents, we currently working outside of an architecture setting, full-time caregivers, or unemployed. Most of these individuals were working in another setting, but still influenced the built environment in some way.


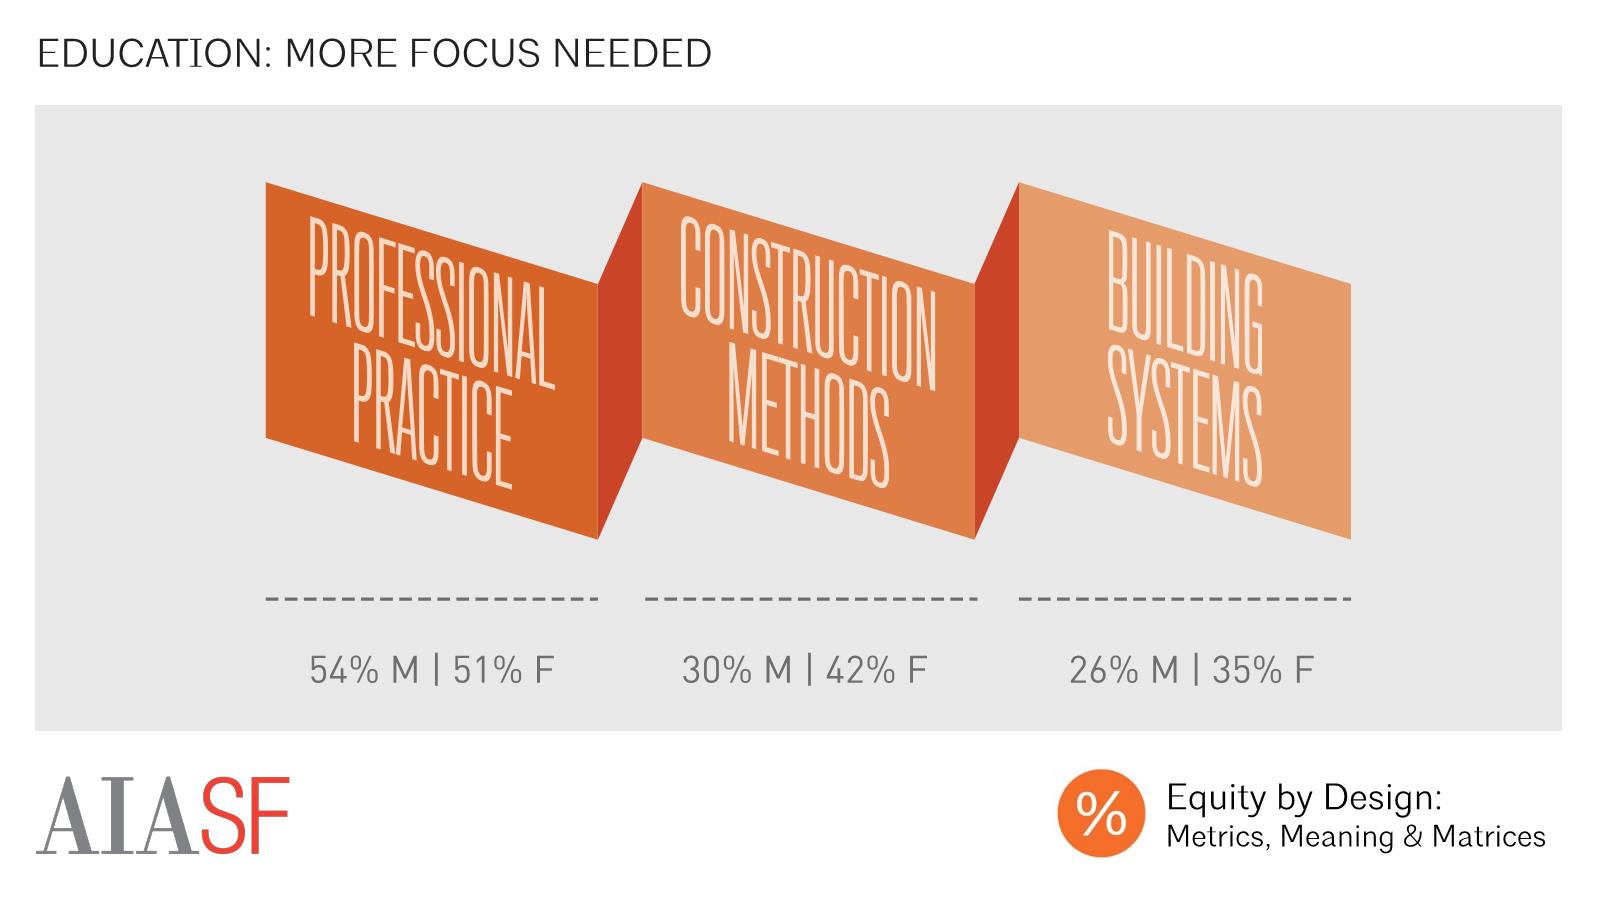
Education: More Focus Needed
The curriculum that both men and women say was most instrumental in preparing them were Design and Design Thinking, Construction Materials and Methods, and Building Systems. Meanwhile, respondents were most likely to say that Professional Practice/Business, Construction Materials and Methods, and Building Systems weren’t addressed fully enough to prepare them for a career in architecture. Women were more likely than men to report needing additional curricular focus on Construction Materials and Methods, and on Building Systems.

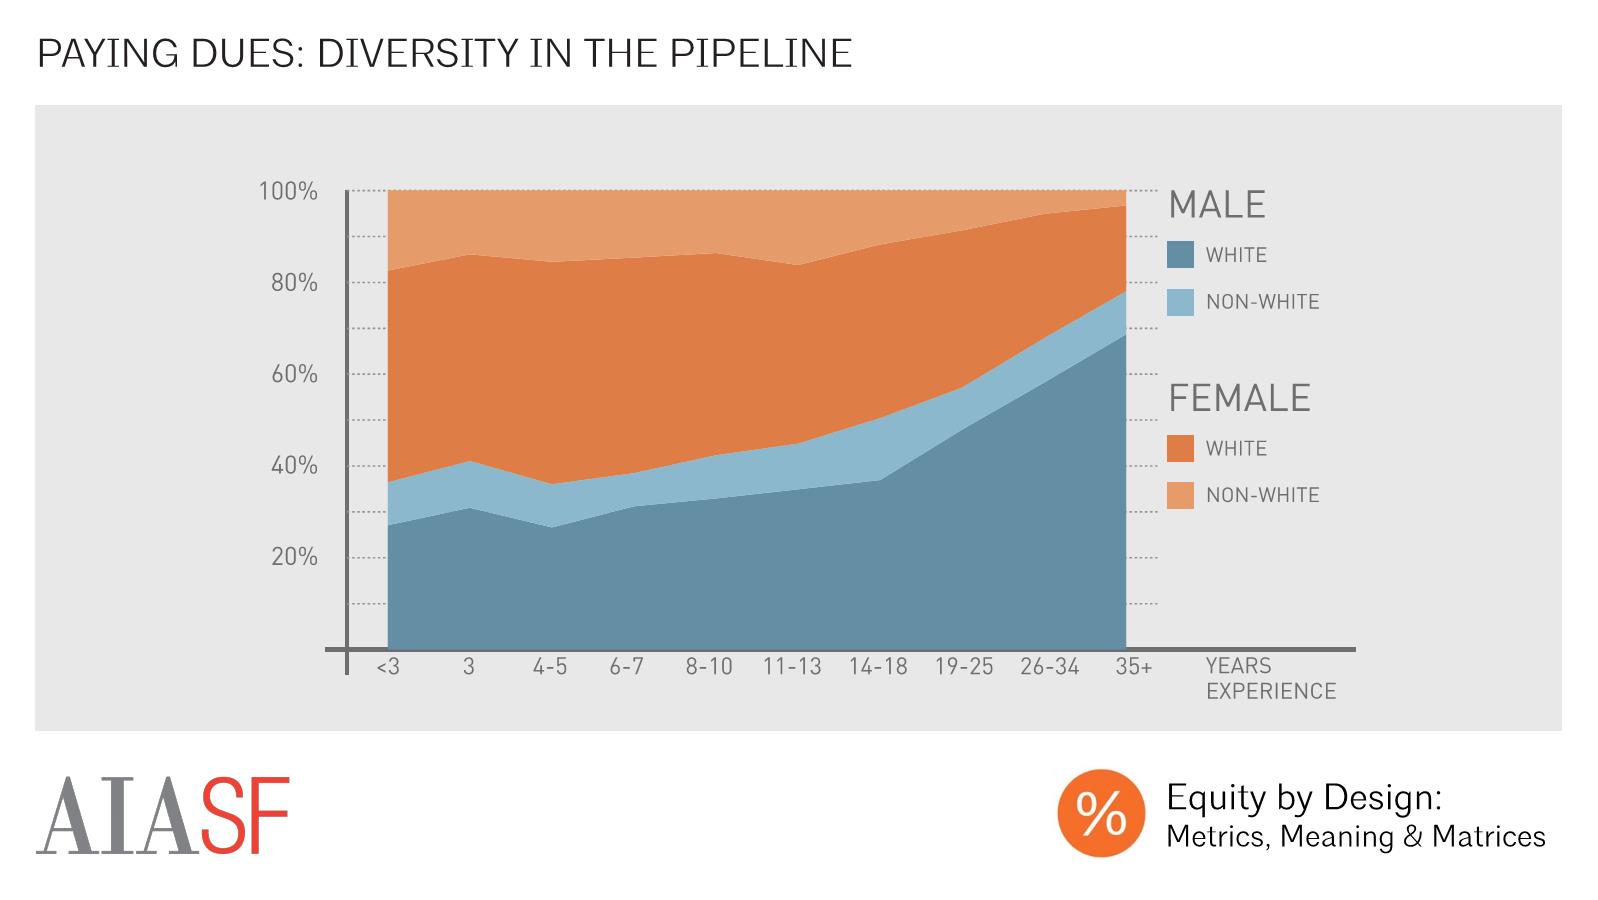
Diversity in the Pipeline
Within our sample, we saw a the greatest level of diversity amongst those with less than five years of experience, with decreasing racial, ethnic, and gender diversity in the field at each subsequent experience level. This phenomenon is explained, in part, because today’s graduating architecture classes are more diverse than they were previously, but it’s also possible that women and people of color are more likely to exit the field than white men are. In order to create and maintain a talent pipeline that reflects the diversity of our communities, employers and individuals alike should consider addressing several key challenges often faced by practitioners within the first five years of their careers in architecture.
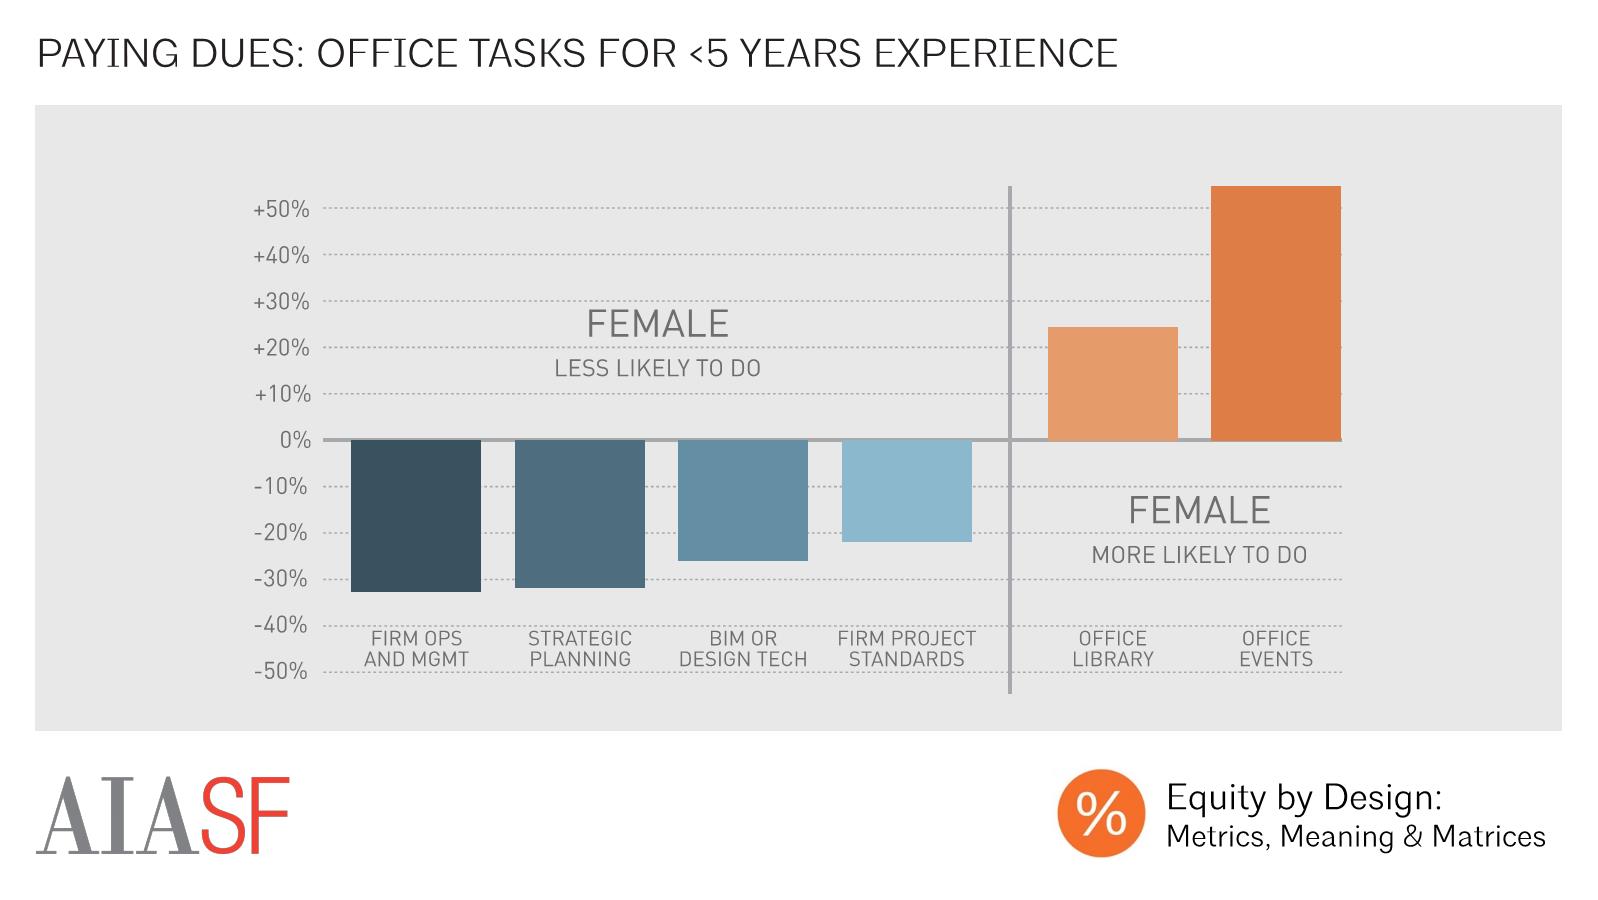
Office Tasks for <5 Years Experience
Even within the first several years of one’s career, there were clear gendered divisions in the office management tasks that respondents took on, with female respondents with less than 5 years experience more likely than their male counterparts to take on planning office events and managing the office library and less likely to take on more strategic tasks like firm project standards, strategic planning, or firm operations and management.
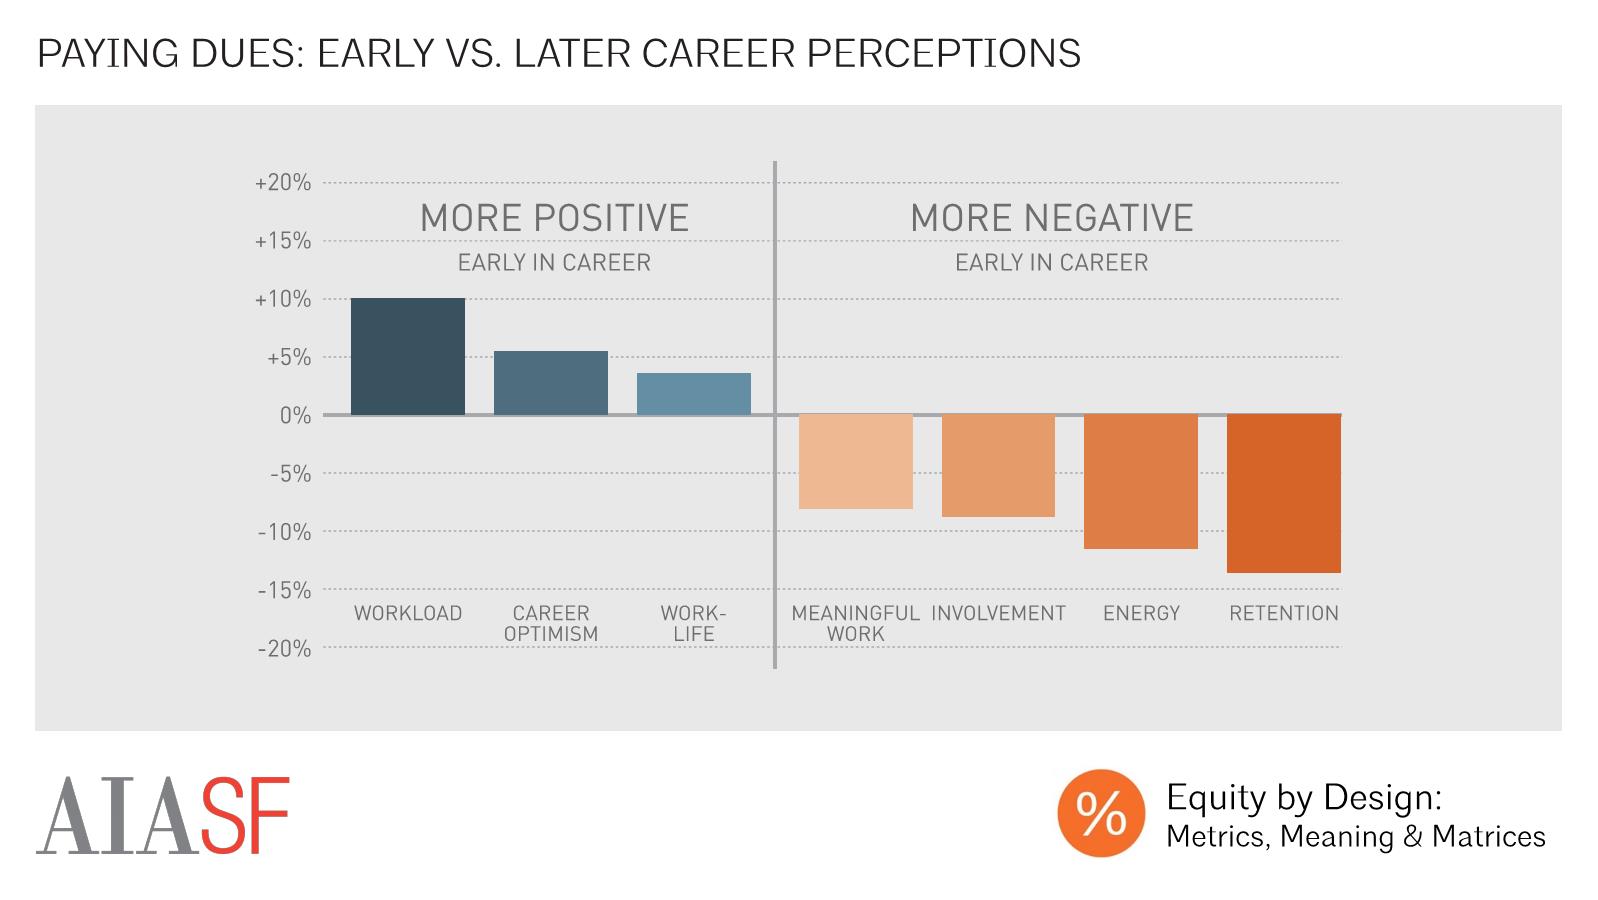
Early vs. Later Career Perceptions
While we were interested in the ways that roles and responsibilities were allocated within the population of early career professionals, we were also interested in the ways in which their experiences compared with those who had more experience. We found that, on the one hand, those early in their careers had more positive perceptions of workload and work life and were more optimistic about their futures. However, those early in their careers also tended to be less likely to find their work meaningful and rewarding, feel less involved in, or energized by, their work, and finally, much less likely to plan to stay at their current job for the next year.

Burnout Likelihood - Early vs. Later Career
There were especially marked differences in the likelihood of burnout, with roughly one in three female respondents with five or less years of experience reporting signs of burnout. This is roughly twice the rate of burnout exhibited by more senior male respondents.

Top Correlations: Early Career Retention Likelihood
Given this group’s heightened likelihood of attrition, we were interested to see that certain firm-led behaviors, like firm leaders providing one-on-one coaching and feedback and including personal and professional growth as a criteria for performance evaluation, we associated with a higher likelihood of planning to stay at one’s job during the first 5 years of an architectural career.

Firm Size by Experience Level
We also observed differences in where respondents reported working on the basis of experience level, with those starting their careers more likely than those with more experience to work in firm with 249 or fewer employees, and much more likely to work in firms with 50 or fewer employees.

Early vs. Later Career Perceptions by Firm Size
The differences in career perceptions between those beginning their careers and more seasoned professionals was most pronounced in the smallest firms. Compared with more experienced professionals working in firms with fewer than 20 employees, early career professionals were much less likely to plan to stay at their current job for the next year, less likely to report being energized by their work, and less likely to report being satisfied by their work.

Reasons for Taking Job by Career Stage
Those beginning their careers also reported different motivations for taking their current positions, with nearly 60% of respondents with five years of less of experience in the field reporting that they had taken their current job because of “opportunities for learning or professional development.”

Mentor ID by Career Stage
While junior employees were more likely to take jobs due to learning and professional development opportunities, they were less likely than more senior employees to receive career guidance or advice from a principal or partner within their firm, but more likely to rely on their managers, and their friends and family.

Sponsor ID by Career Stage
Those early in their careers were more likely, on the other hand, to report that someone within their firm acted as their sponsor or champion, actively advocating for their professional growth and advancement. Roughly 59% of those early in their careers reported having a sponsor, compared with 49% of those later in their careers. Senior firm leaders were the most frequently-cited sponsors.

Workplace Relationships by Career Stage
Those with five or less years of experience exhibited slightly different social patterns than their more experienced counterparts, with those beginning their careers more likely to report eating lunch with co-workers, and socializing outside of work. Meanwhile, however, those with more experience were more likely to report that they had close friendships at work.

Top-Rated Workplace Culture Initiatives by Career Stage
There were also differences in the ways in which the most junior practitioners preferred that their employers support firm culture. While social events were the top-rated workplace culture initiative according to junior and more experienced employees alike, those with more than five years of experience were much more likely than their more junior counterparts to believe that sharing company goals and achievements, inviting employees to participate in strategic decision making, holding all-team meetings, and recognizing professional achievements were beneficial to firm culture.
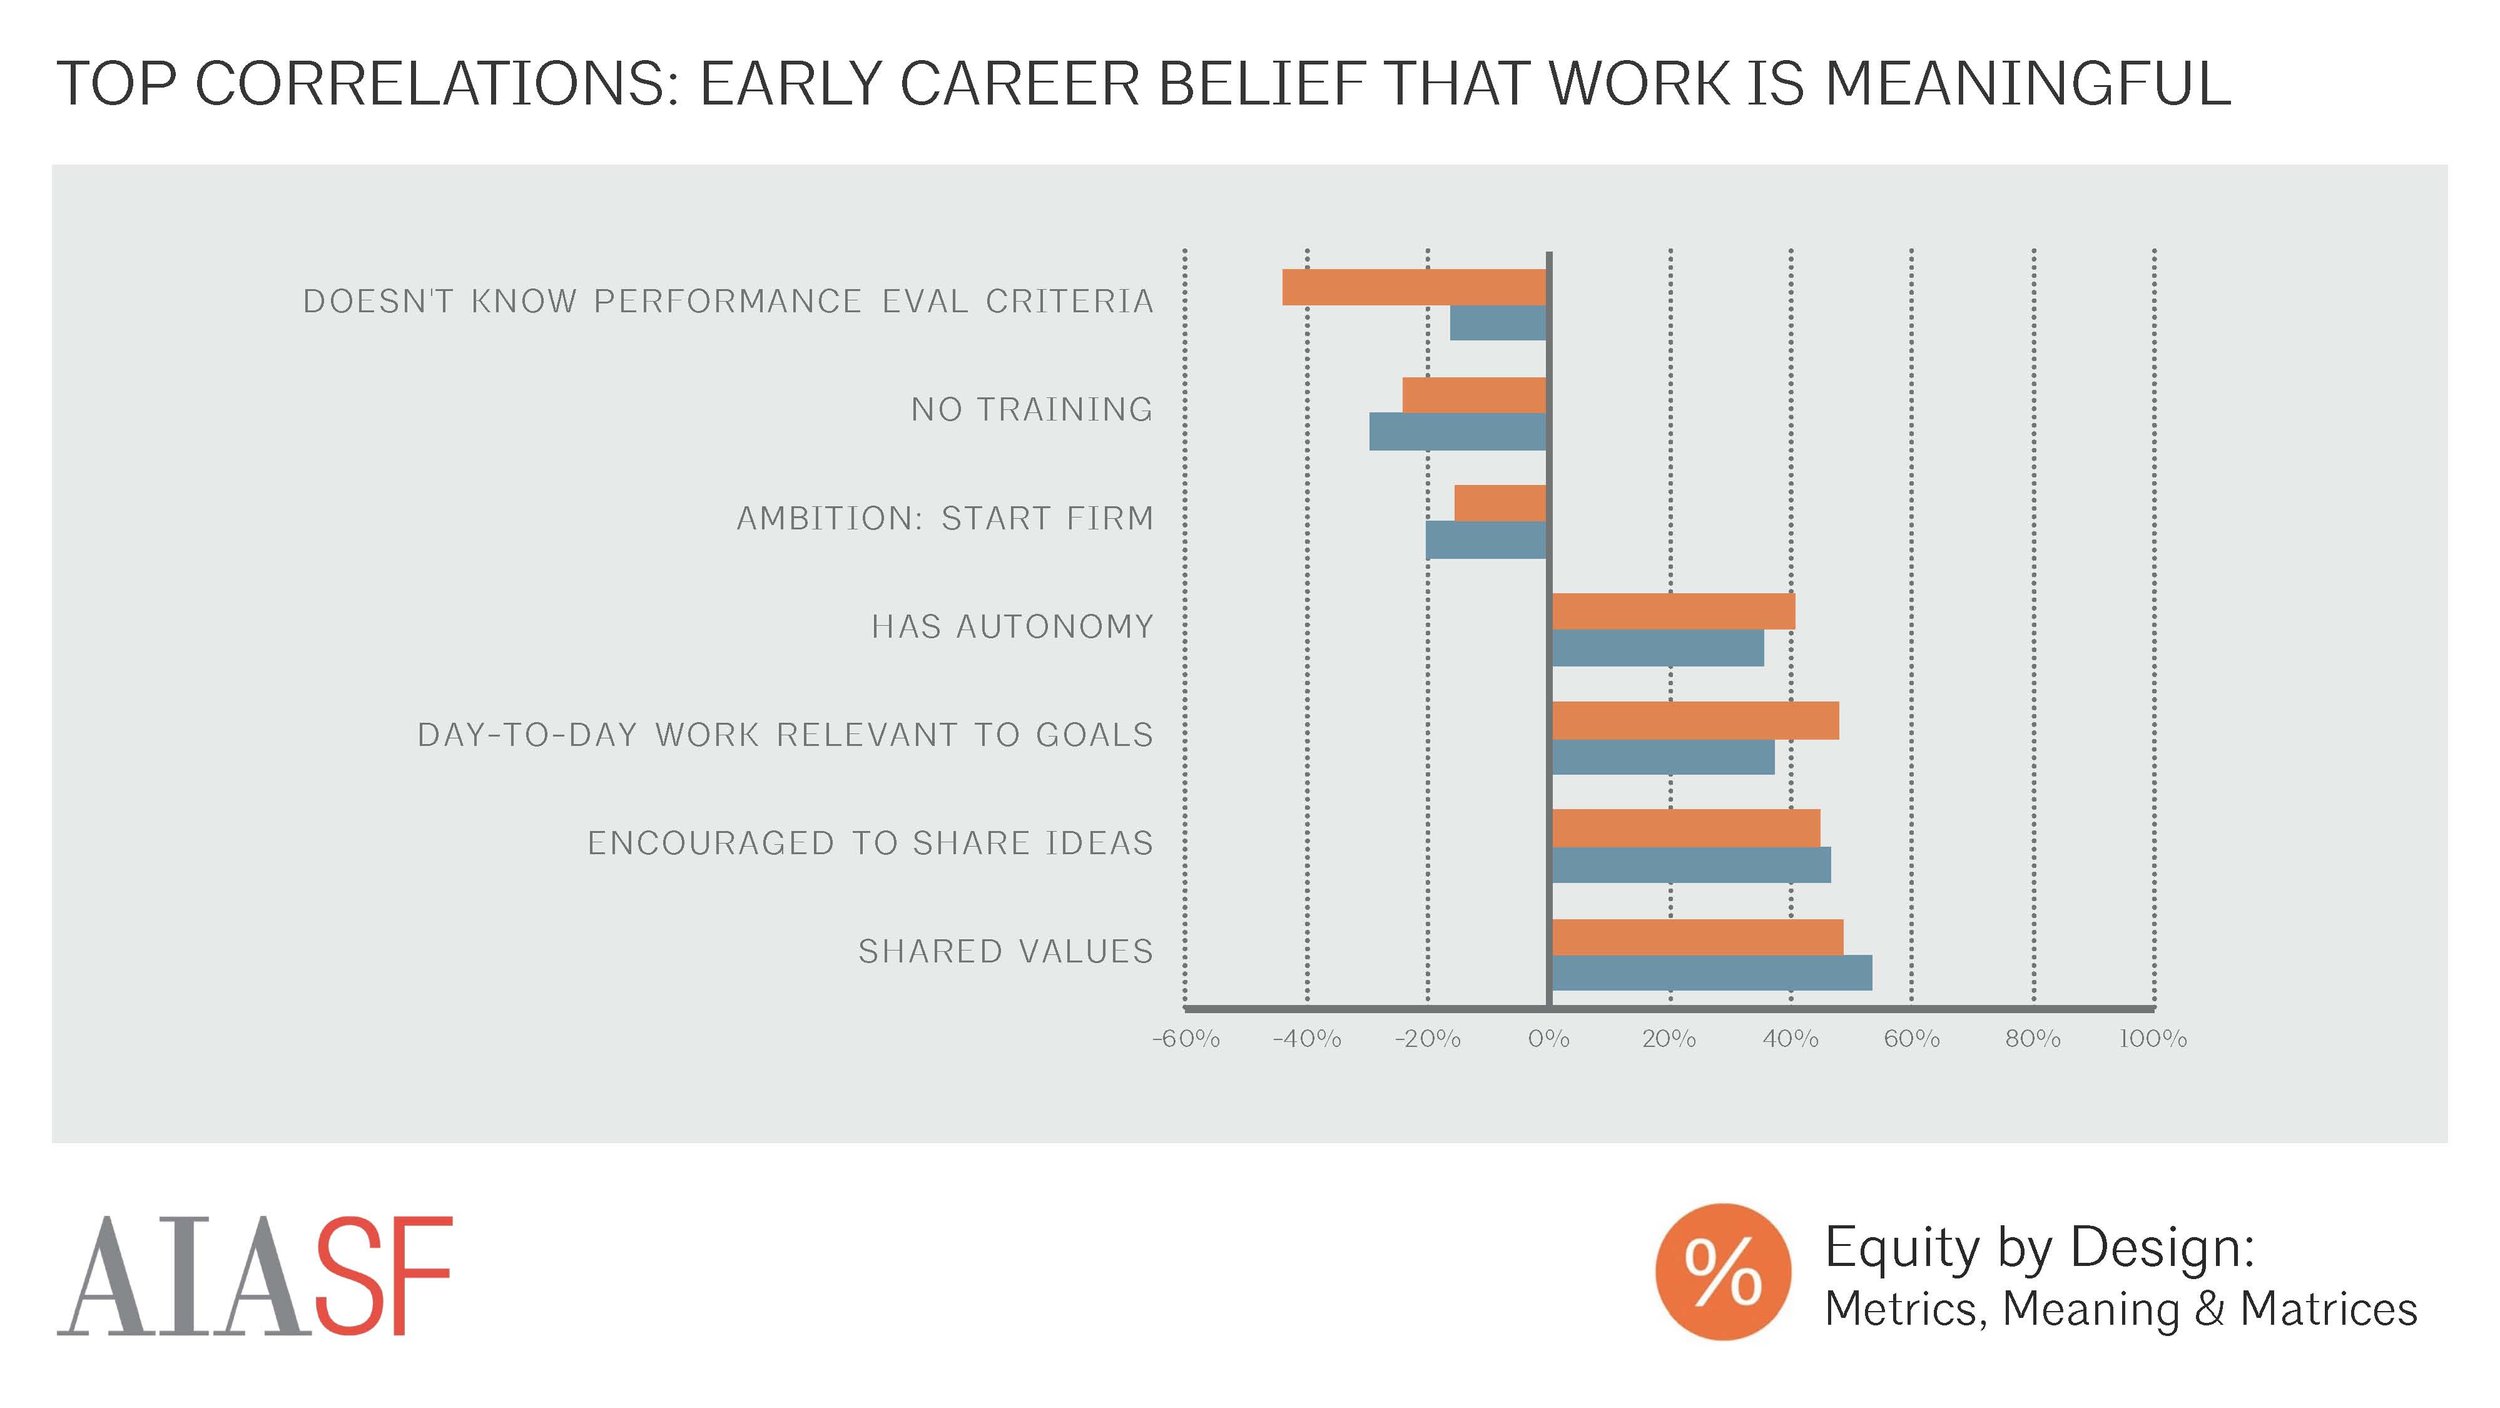
Meaning and Reward
This mix of professional growth and strong relationships was strongly correlated with whether or not respondents at the beginning of their careers believed that their work was meaningful and rewarding, with those who didn’t know their firm’s performance evaluation criteria, or who didn’t receive training for new roles, less likely to find their work meaningful and rewarding. Meanwhile, those who shared their firm’s values, were encouraged to share ideas at work, believed that their day to day work was relevant to their long-term goals, and had sufficient autonomy to make the decisions needed to complete their work were most likely to find their work meaningful and rewarding.
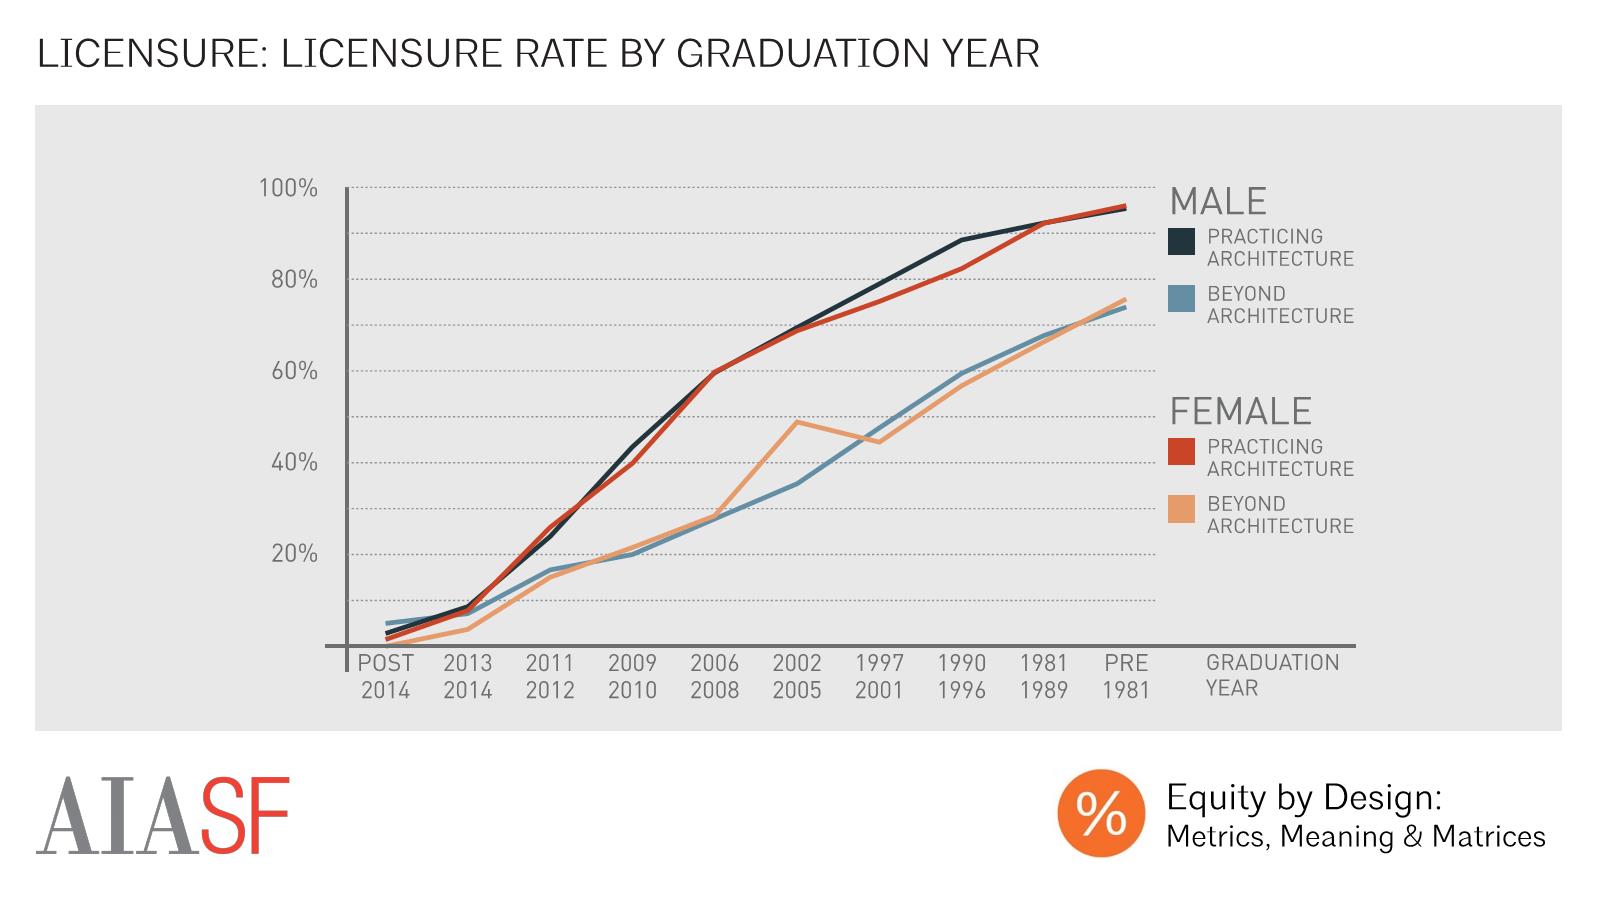
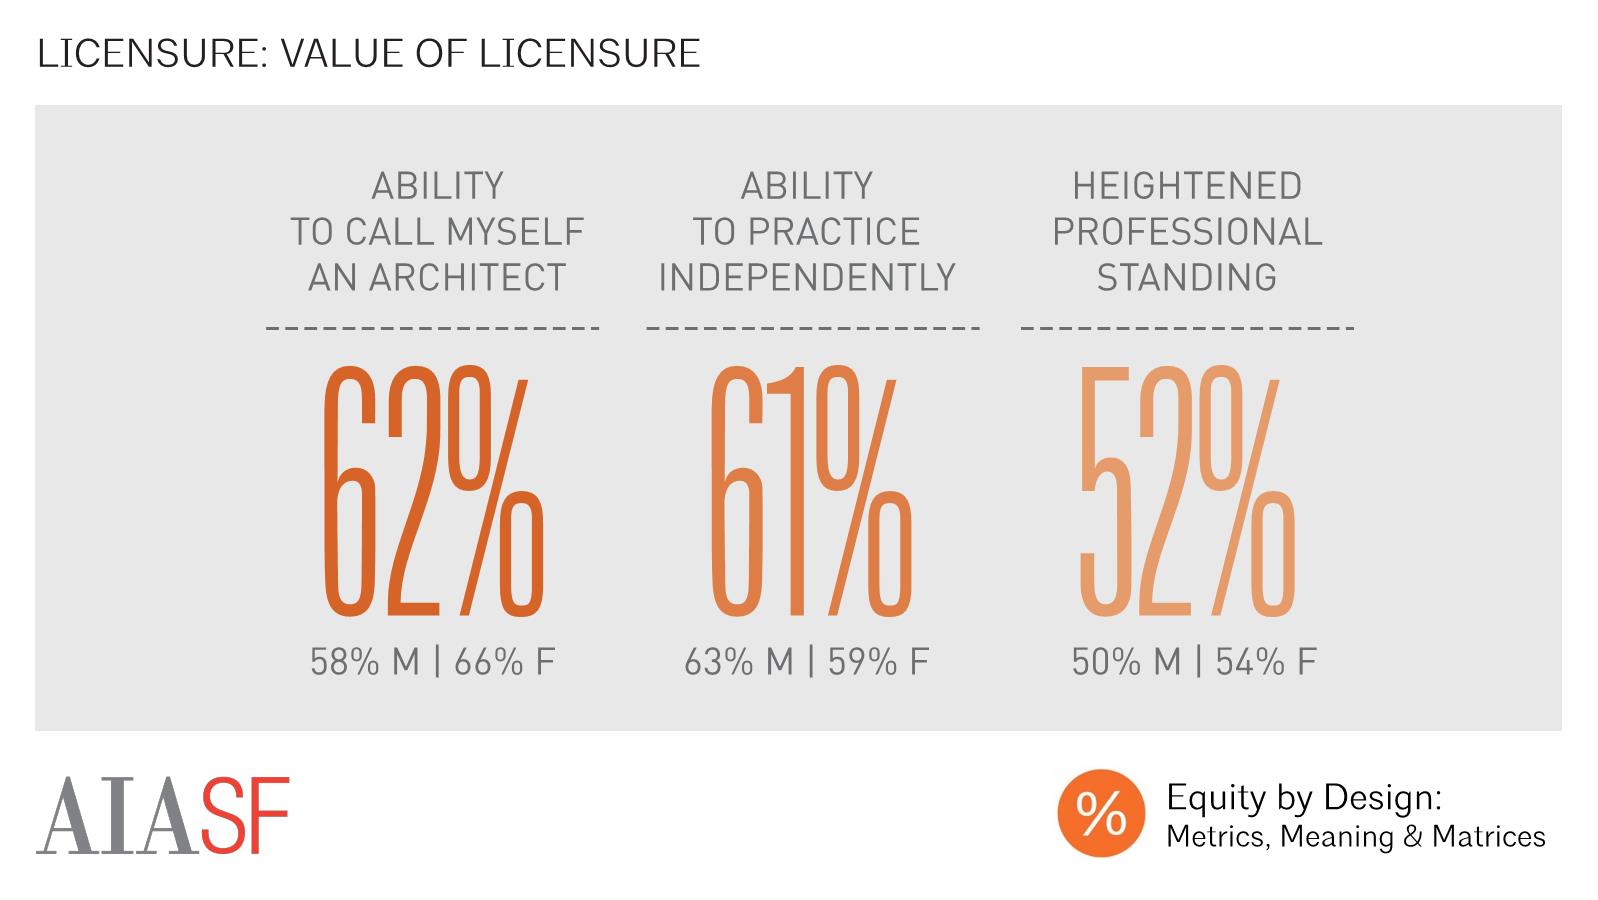
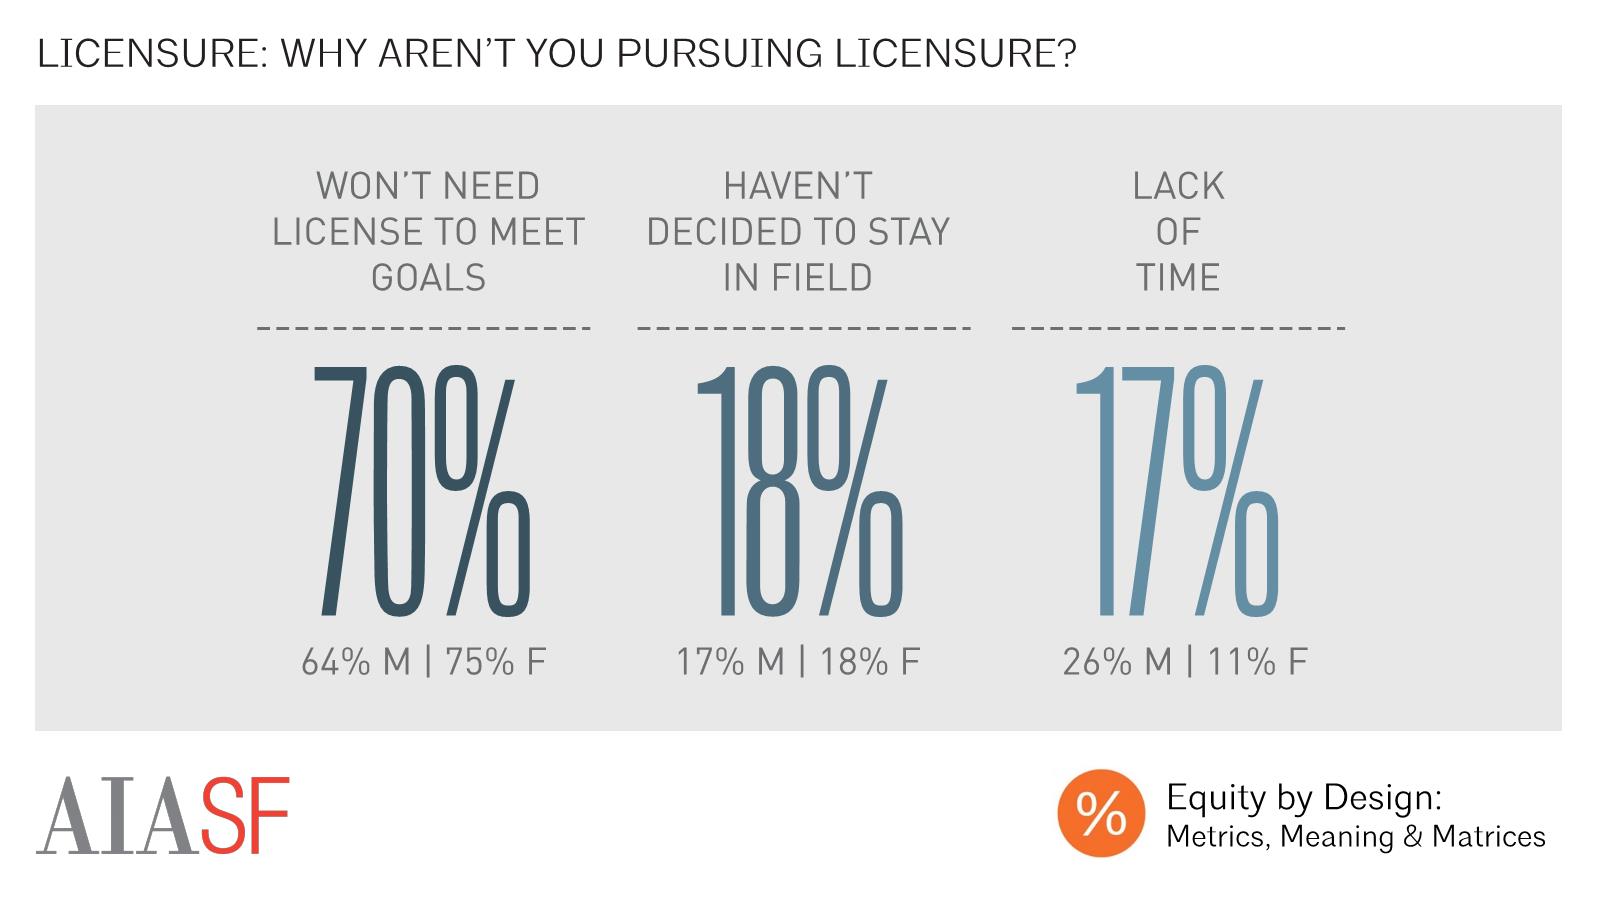
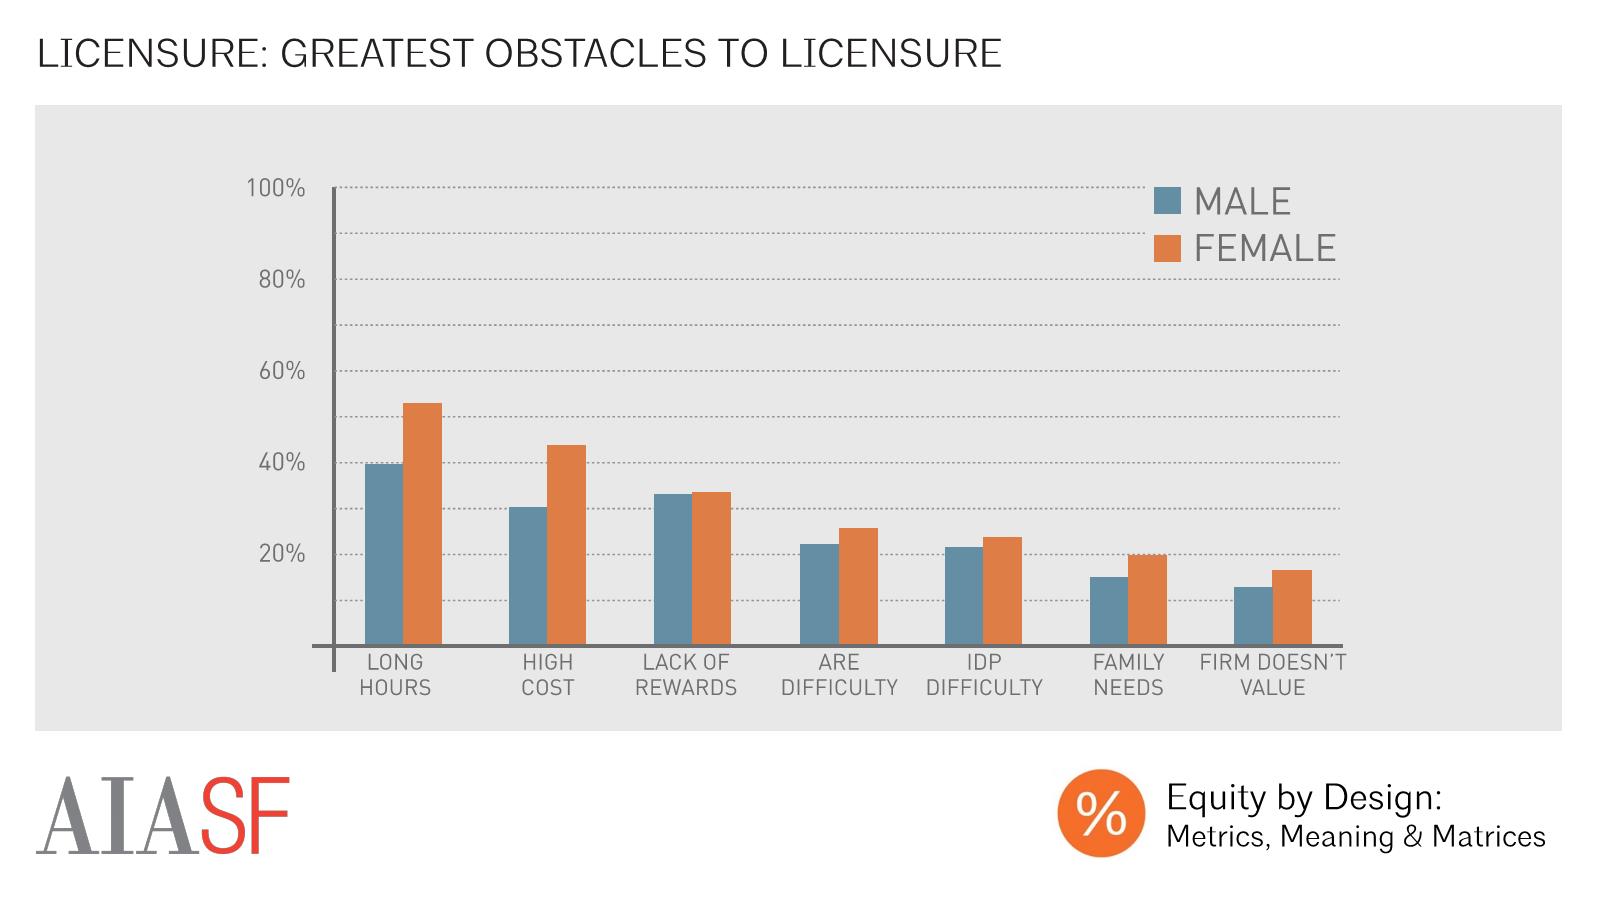
Greatest Obstacles to Licensure
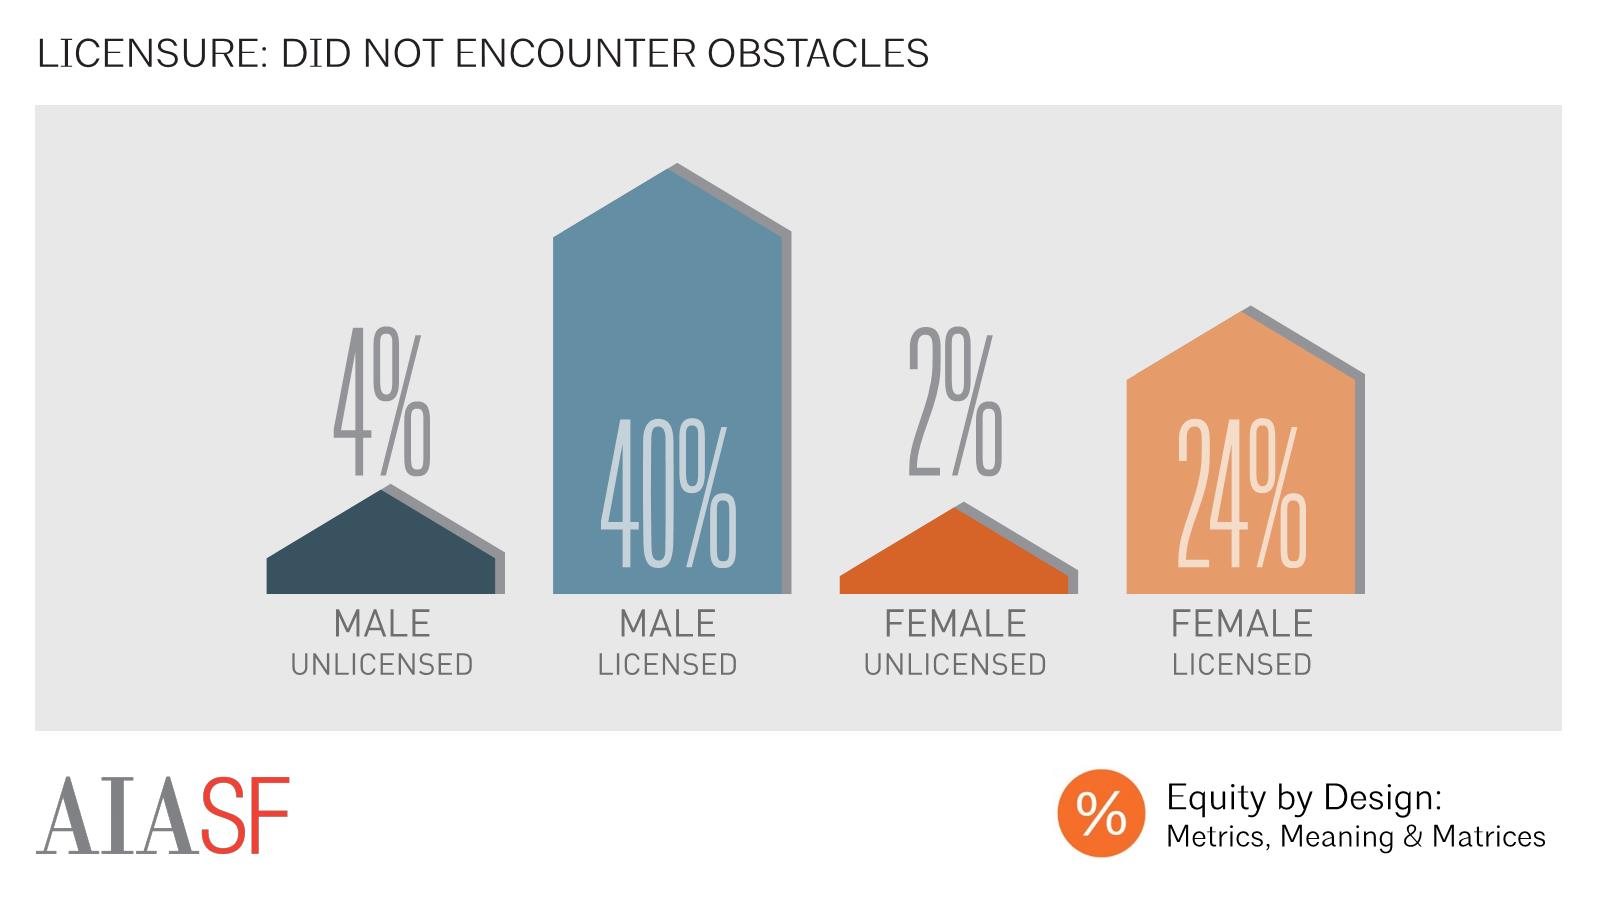
The survey demonstrated that licensure presents many professionals with challenges, with long work hours, the high cost of registration and exams, and low perceived rewards as the most frequently cited challenges. Female respondents were more likely than male respondents to experience every one of these challenges to licensure.
Likelihood of Being a Parent
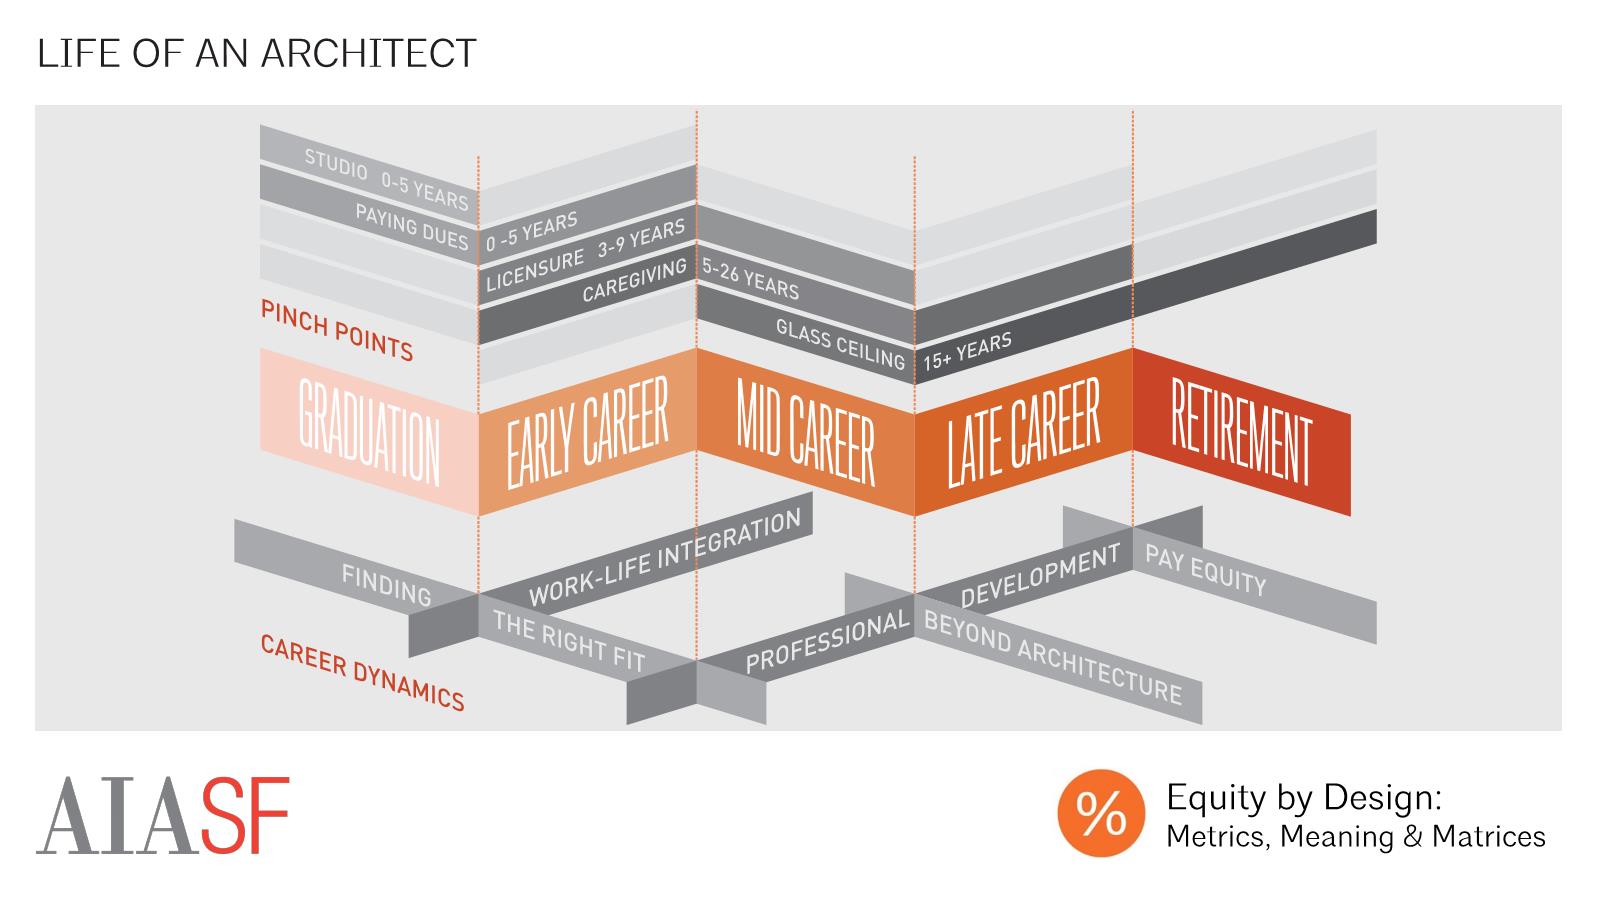
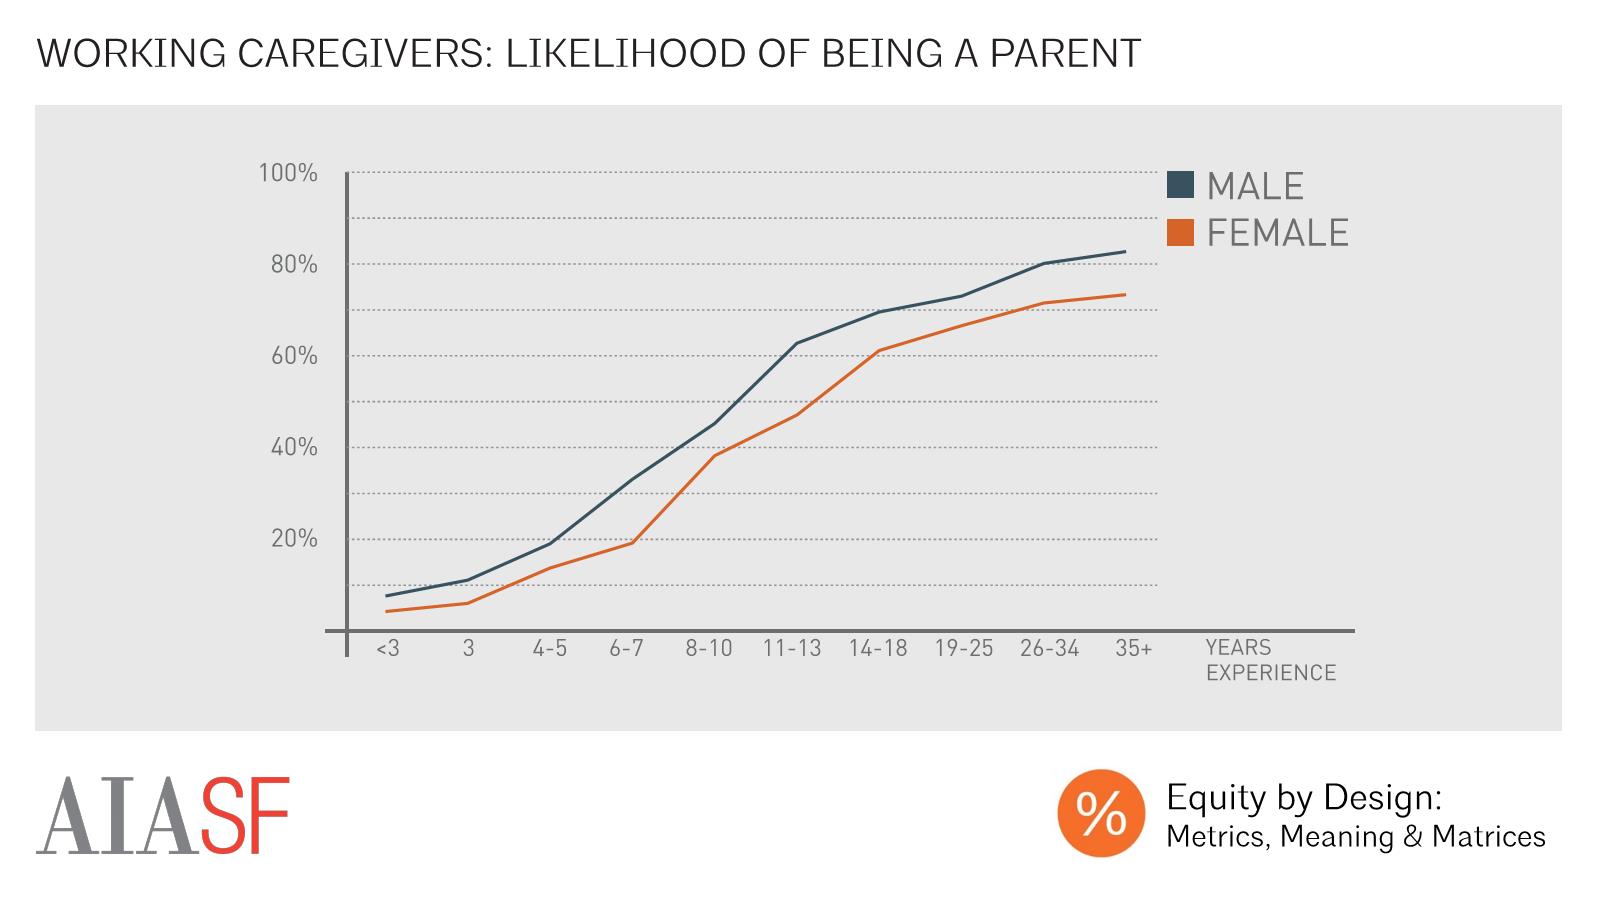
The next major career pinchpoint – working caregivers – impacts many of our respondents. Amongst those currently practicing architecture, female respondents were less likely to have children than their male counterparts at every level of experience. This could suggest that female practitioners who have children are more likely than male practitioners with children to leave the field, resulting in a higher likelihood of being a practicing father than being a practicing mother. It could also suggest that women who pursue architecture are simply less likely than their male counterparts to become parents. Neither hypothesis can be confirmed by this survey, but this question is worth exploring in future research.

Childcare Responsibilities
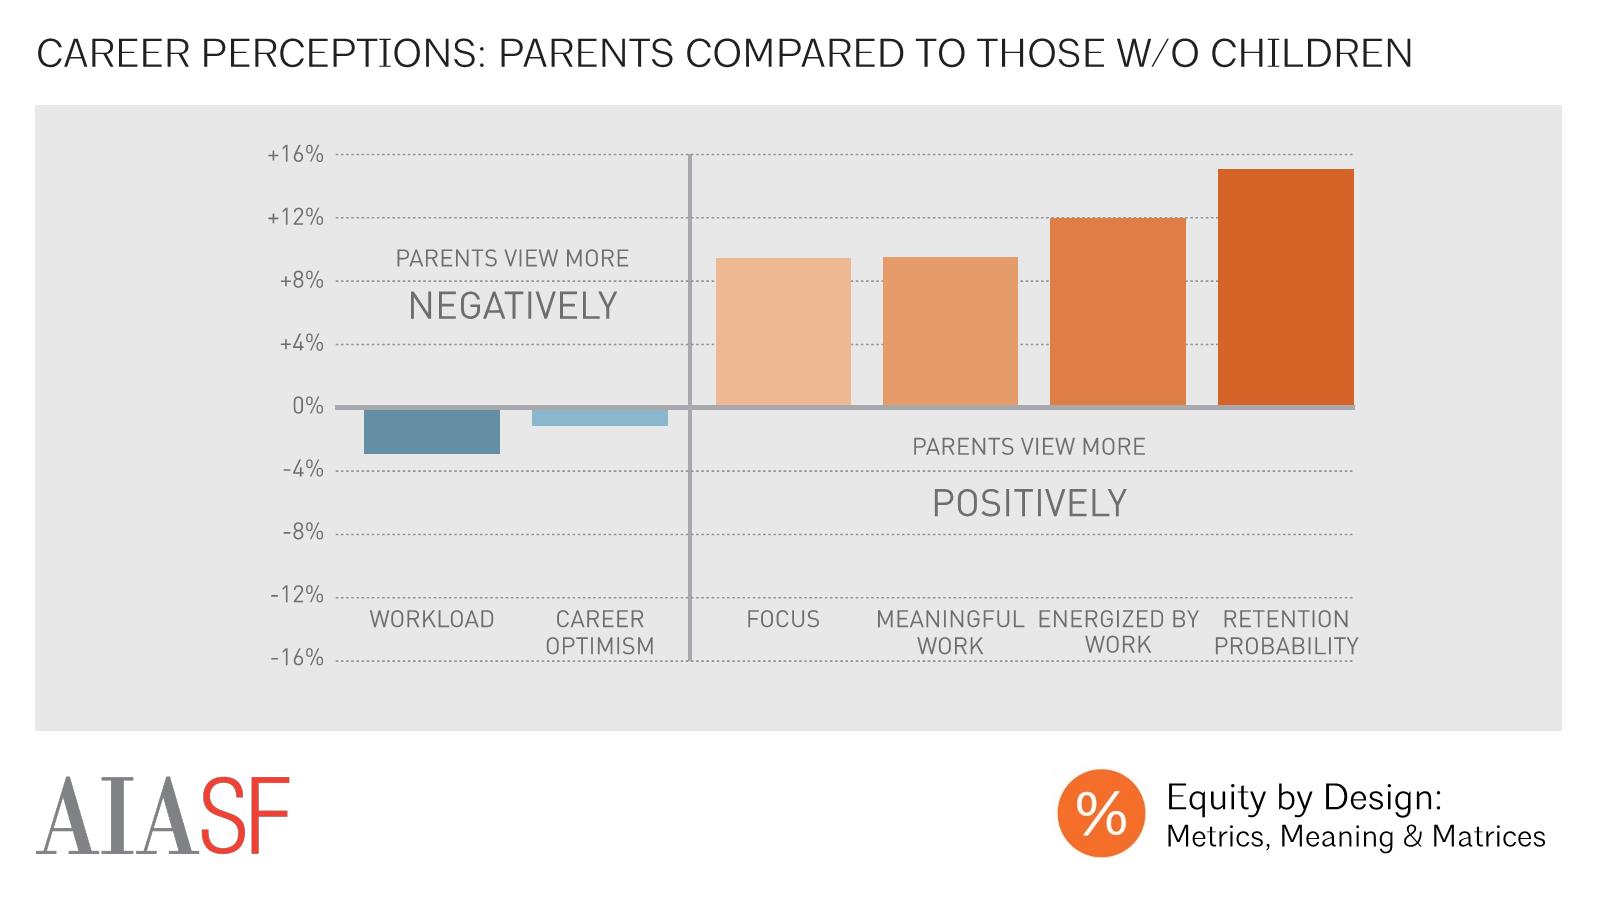
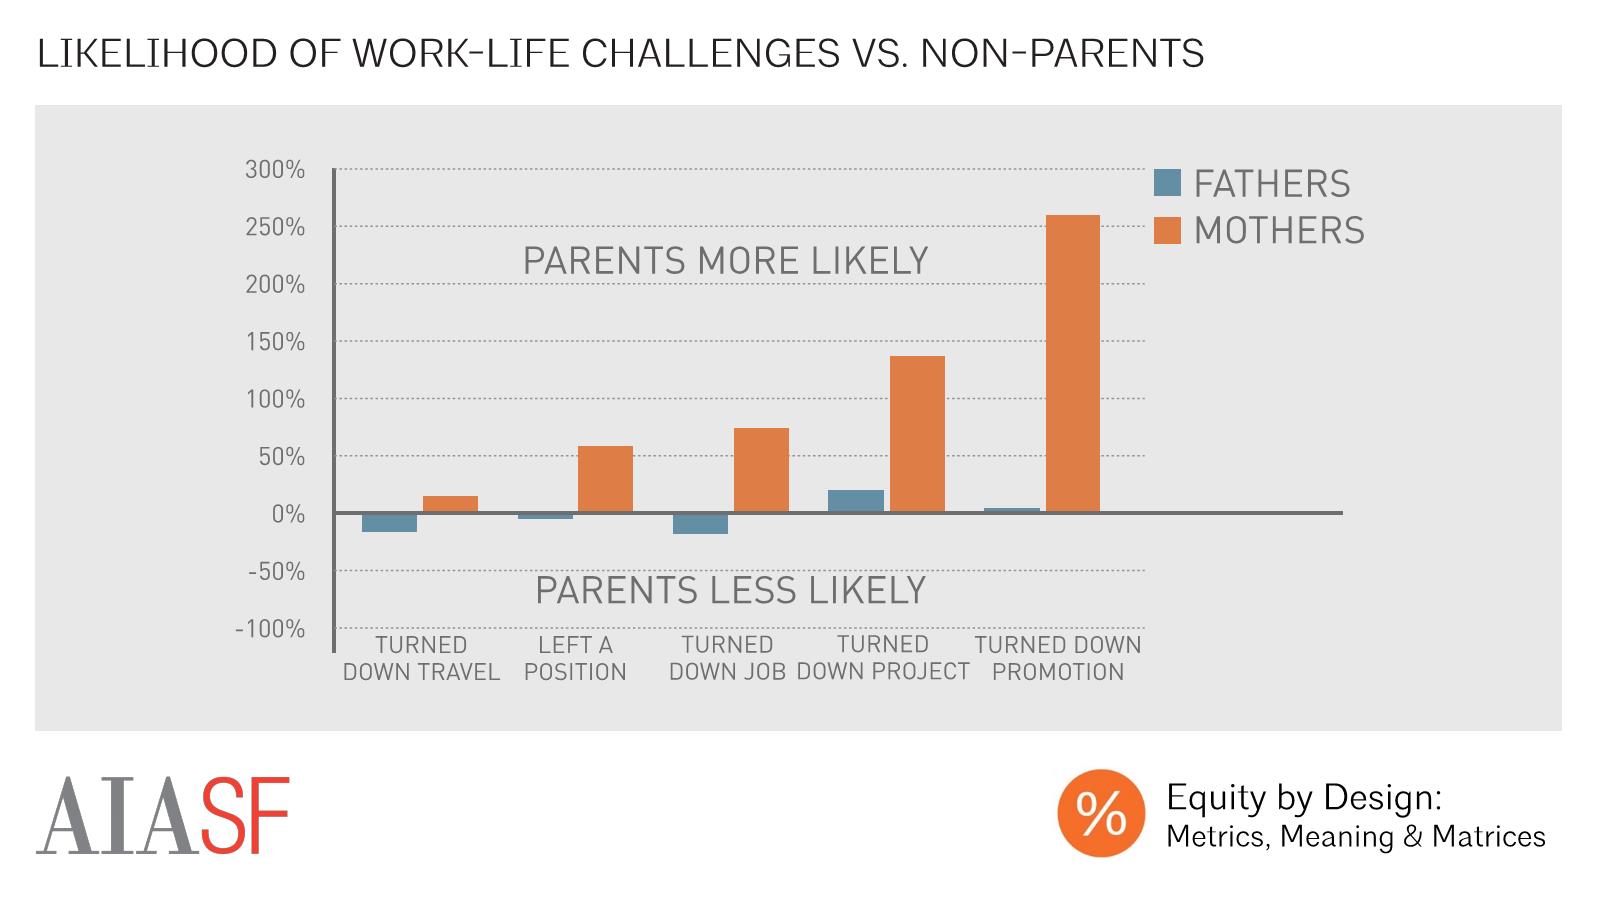
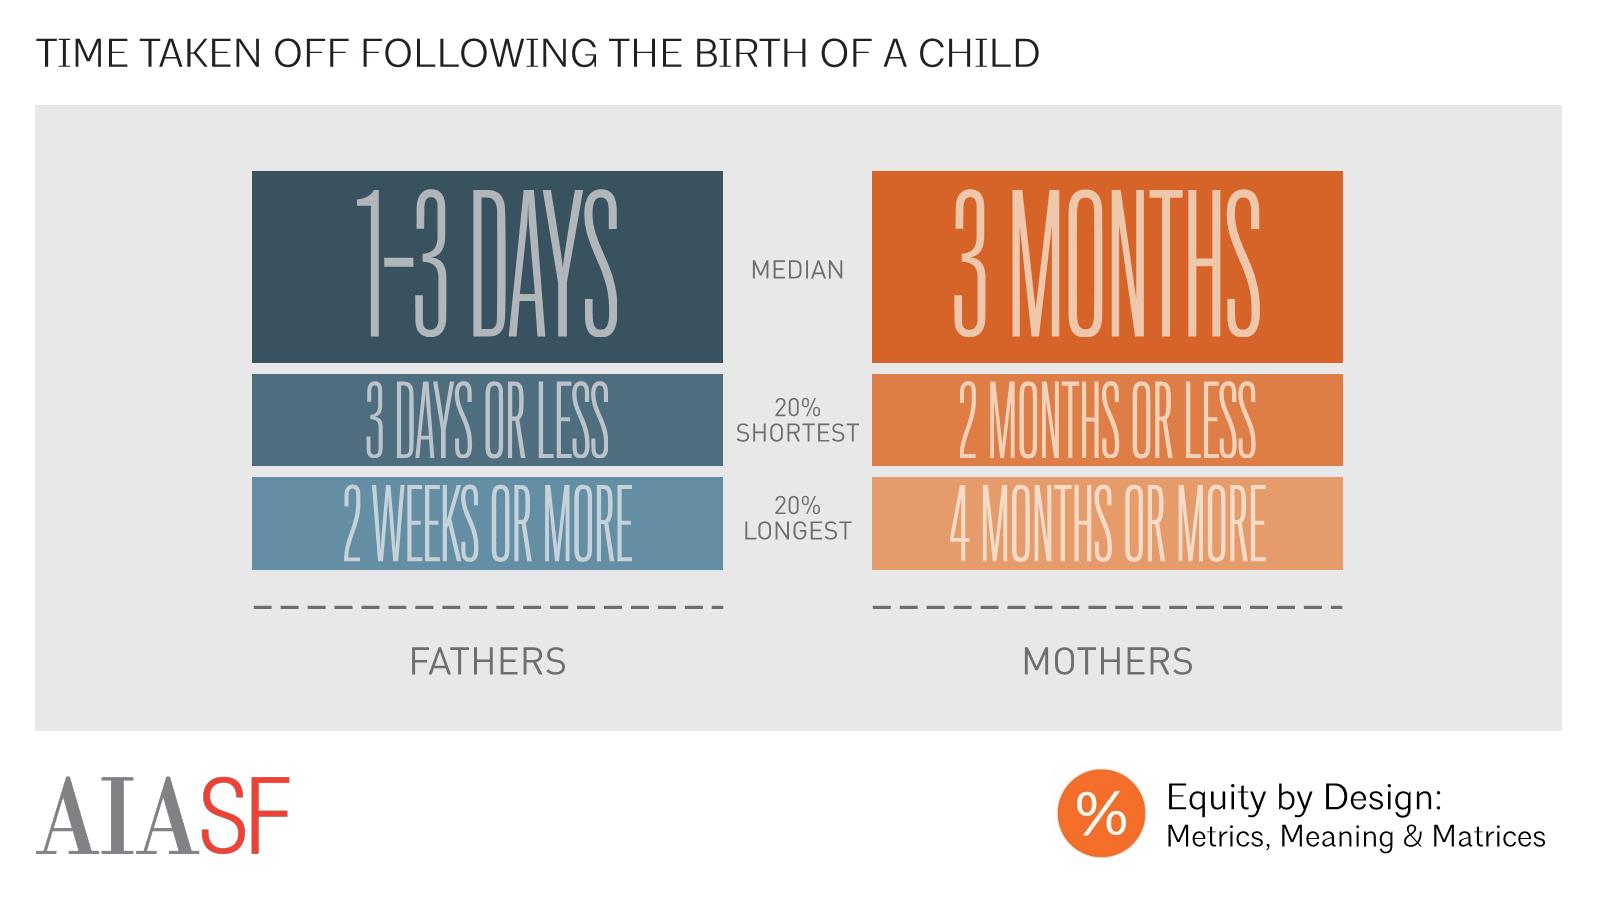
While female respondents were less likely than their male counterparts to be working parents, we found that those who were parents tended to bear more responsibility for childcare. Working mothers were approximately 10 times as likely as their male counterparts to be their children’s primary caregiver (48% of mothers vs. 5% of fathers). Meanwhile, 55% of fathers, and 10% of mothers, reported that their partner did more childcare.

Gender Balance Amongst Firm Leadership
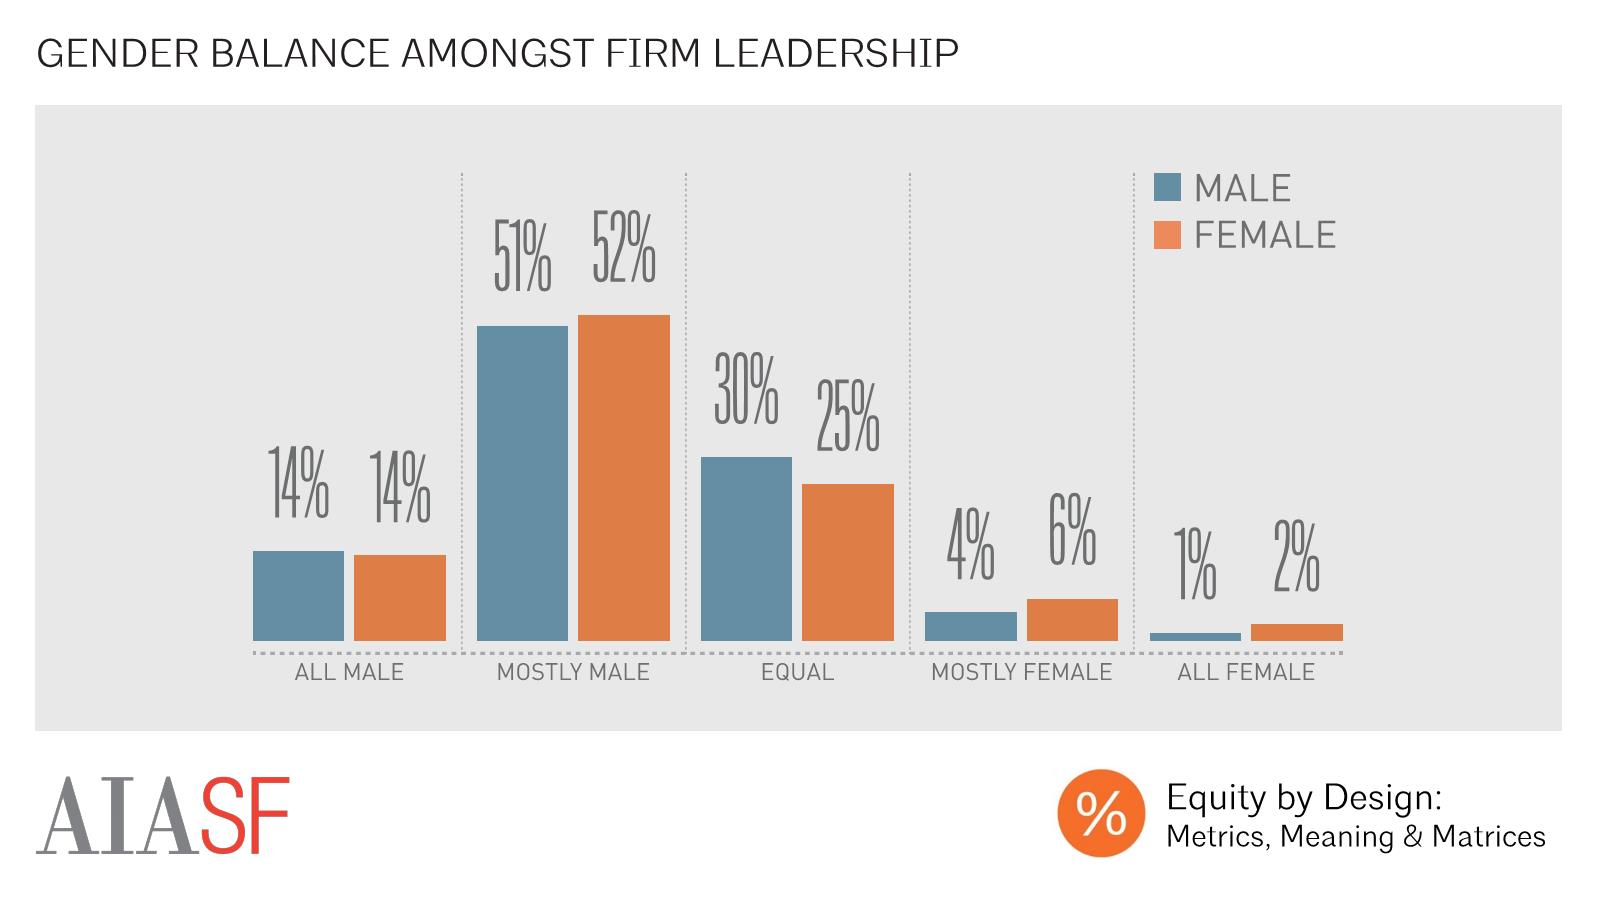
The culmination of all of these pinch points is a glass ceiling that we’ve found persists in architecture. While 8% of our female respondents, and 5% of our male respondents reported working in a firm that was mostly, or completely led by women, the majority of our respondents – male and female—reported working in a firm that was mostly or completely led by men.
Likelihood of Being a Titled Firm Leader
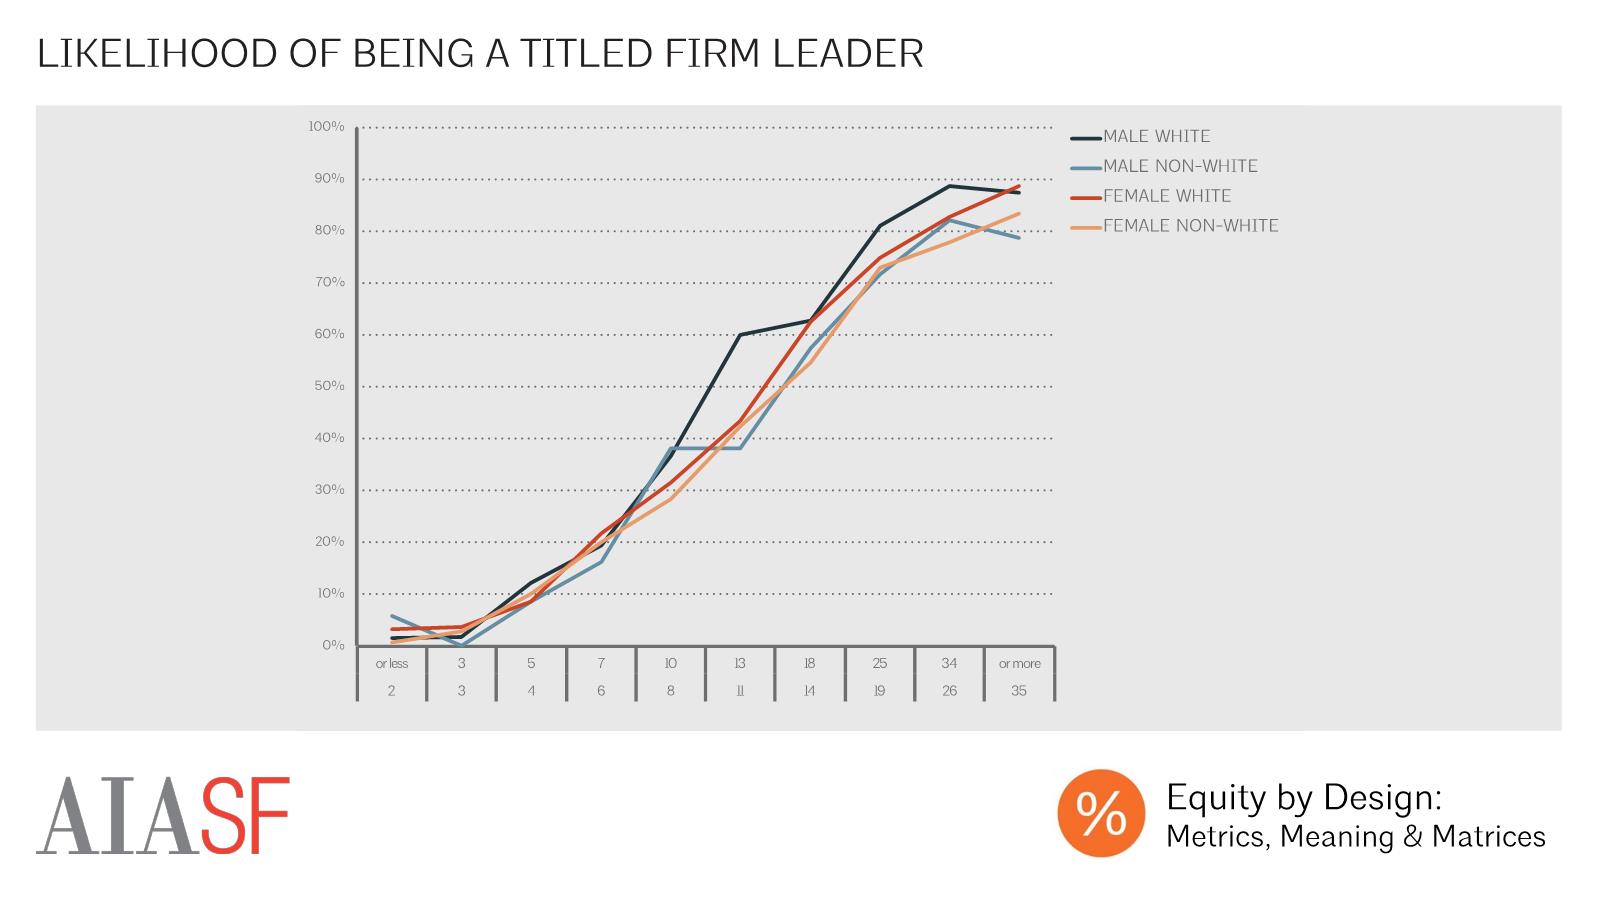
Women and people of color were less likely to be firm leaders at every level of experience. This leadership gap is at its greatest amongst those with 11-13 years of experience, with 60% of men in that category, but only 38% of non-white men, 43% of white women, and 42% of non-white women, holding a titled leadership position. Amongst those with 11 or more years of experience, white men are most likely to hold firm leadership positions at each level of experience, followed by white women, and then by men and women of color.

Likelihood of Being a Principal
Women and people of color were less likely to be principals or partners in a firm at every level of experience, with men of color least likely of any group to hold this title. Significant gaps emerged amongst those with more than 10 years of experience, and generally increased as level of experience increased.
These gaps, paired with findings on likelihood of being a titled firm leader, suggests that white women, men of color, and women of color progress into mid-level titled positions at only slightly lower rates than white men, but are much less likely to make the jump into principal or partner positions.

Likelihood of Being a Principal by Firm Size
Firm size was significantly correlated with likelihood of being a principal or partner, with those working in the smallest firms most likely to be principals or partners at every level of experience.
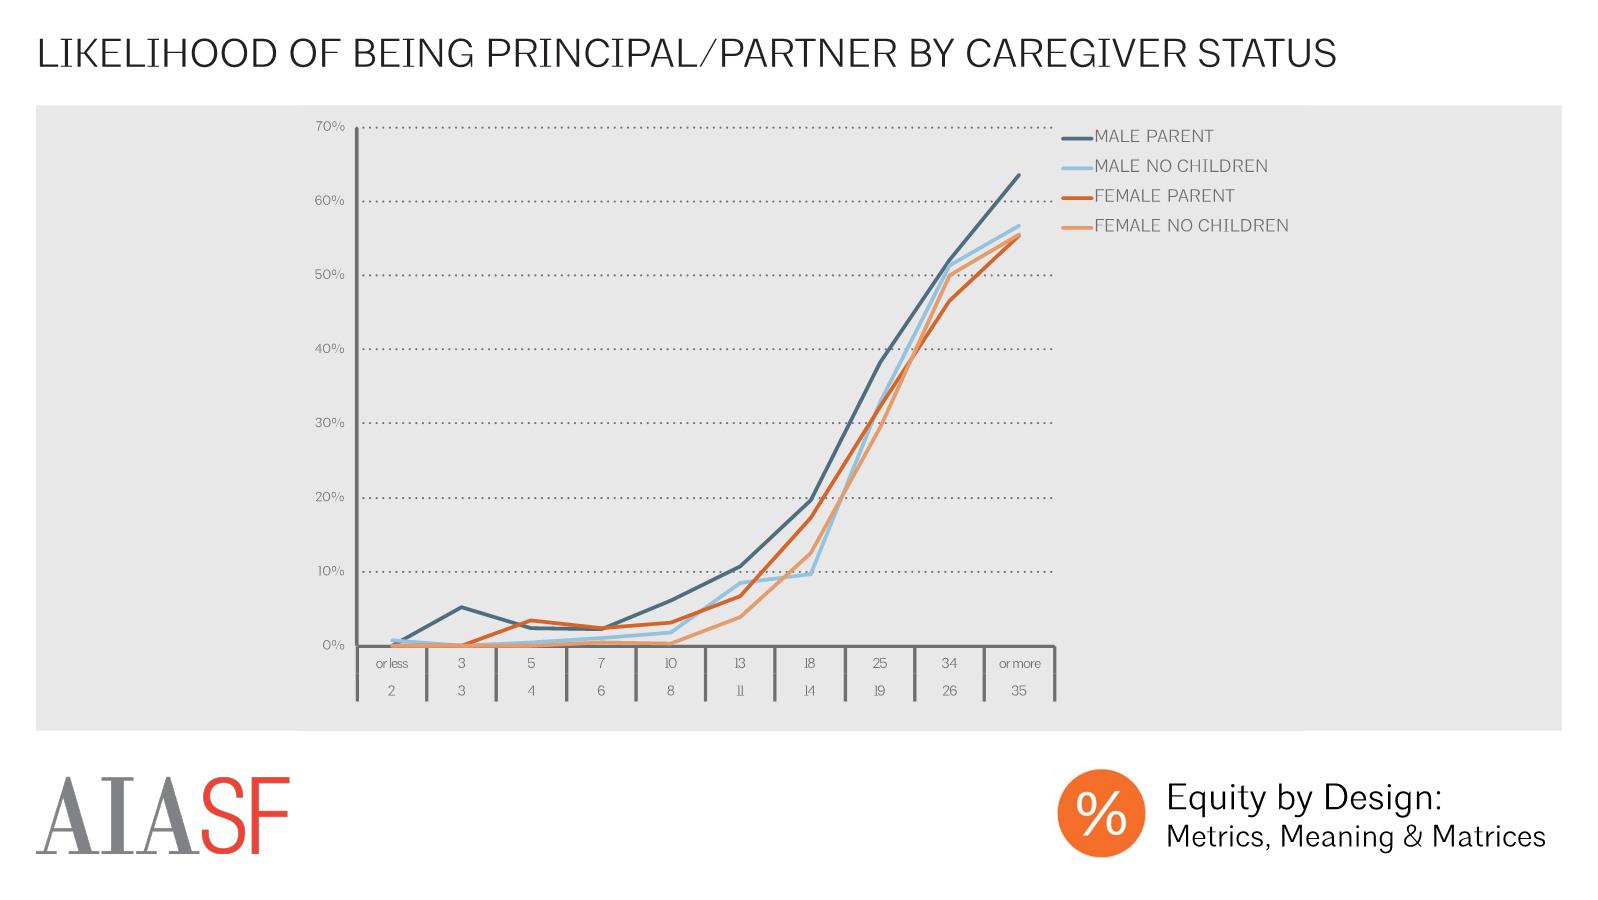
Likelihood of Being a Principal by Caregiver Status
Amongst both male and female respondents, parents were slightly more likely than those without children to be principals or partners at nearly every level of experience (women without children with 26 or more years of experience were slightly more likely than those with children to be principals or partners). For both men and women the widest “parent advantage” in terms of firm leadership exists between 14 and 18 years of experience.
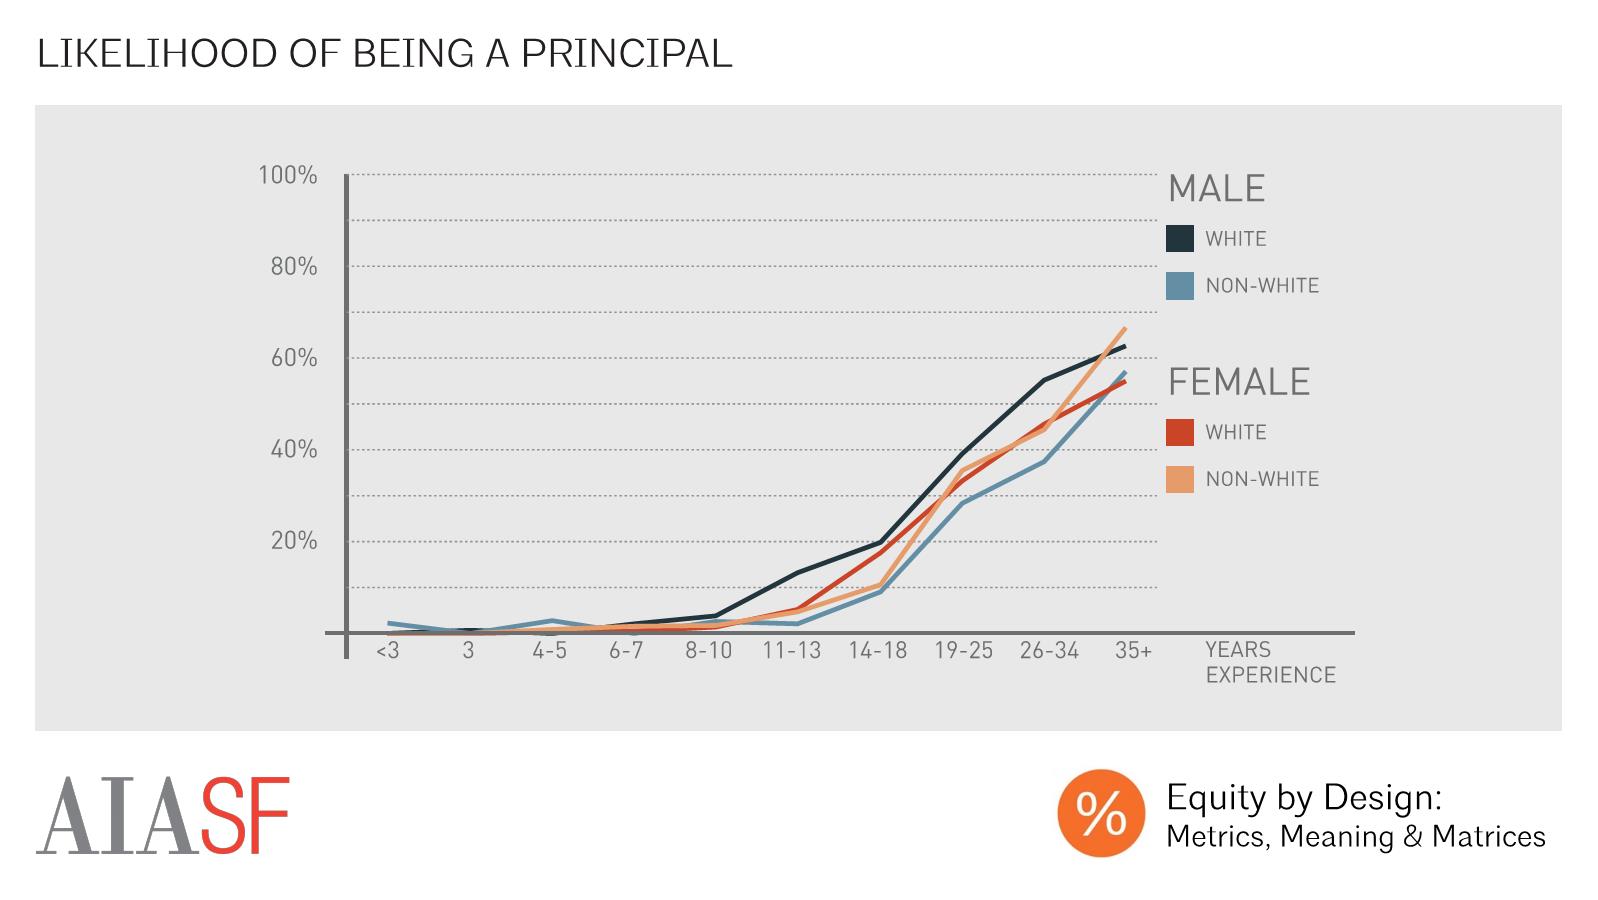
Likelihood of Being Principal by Years Experience
While some of this leadership imbalance may be attributable to the pipeline issues (i.e. more men than women entered the field in the past, resulting in more men positioned for leadership in the present), this isn’t the entire story. White male respondents were more likely than non-white men and both white women and women of color to be principals or partners at nearly every level of experience. Men of color were the least likely of any group to be principals or partners in a firm.

Principals/Partners: Firm Size
In addition to being less likely to be principals or partners in firms, women and people of color who did hold these titles tended to make less money, and manage smaller firms, on average, than male principals and partners. Amongst principals and partners, female partners were slightly more likely to work in an extra-small or small firm, while male partners were more likely to work in an extra-large firm.

Principals/Partners: Equity Share by Firm Size
Not all firm leadership positions entail firm ownership. The strongest predictor of equity share amongst principals was firm size, with both male and female partners in smaller firms more likely to be equity partners, and more likely to own larger portions of their firms, than those who worked in larger firms. Within firms with fewer than 50 employees, female principals were more likely than their male counterparts to own more than half of, their firms. Meanwhile, in M, L, and XL firms, most employees owned less than 25% of their firms, and male and female partners owned similar portions of their firms.
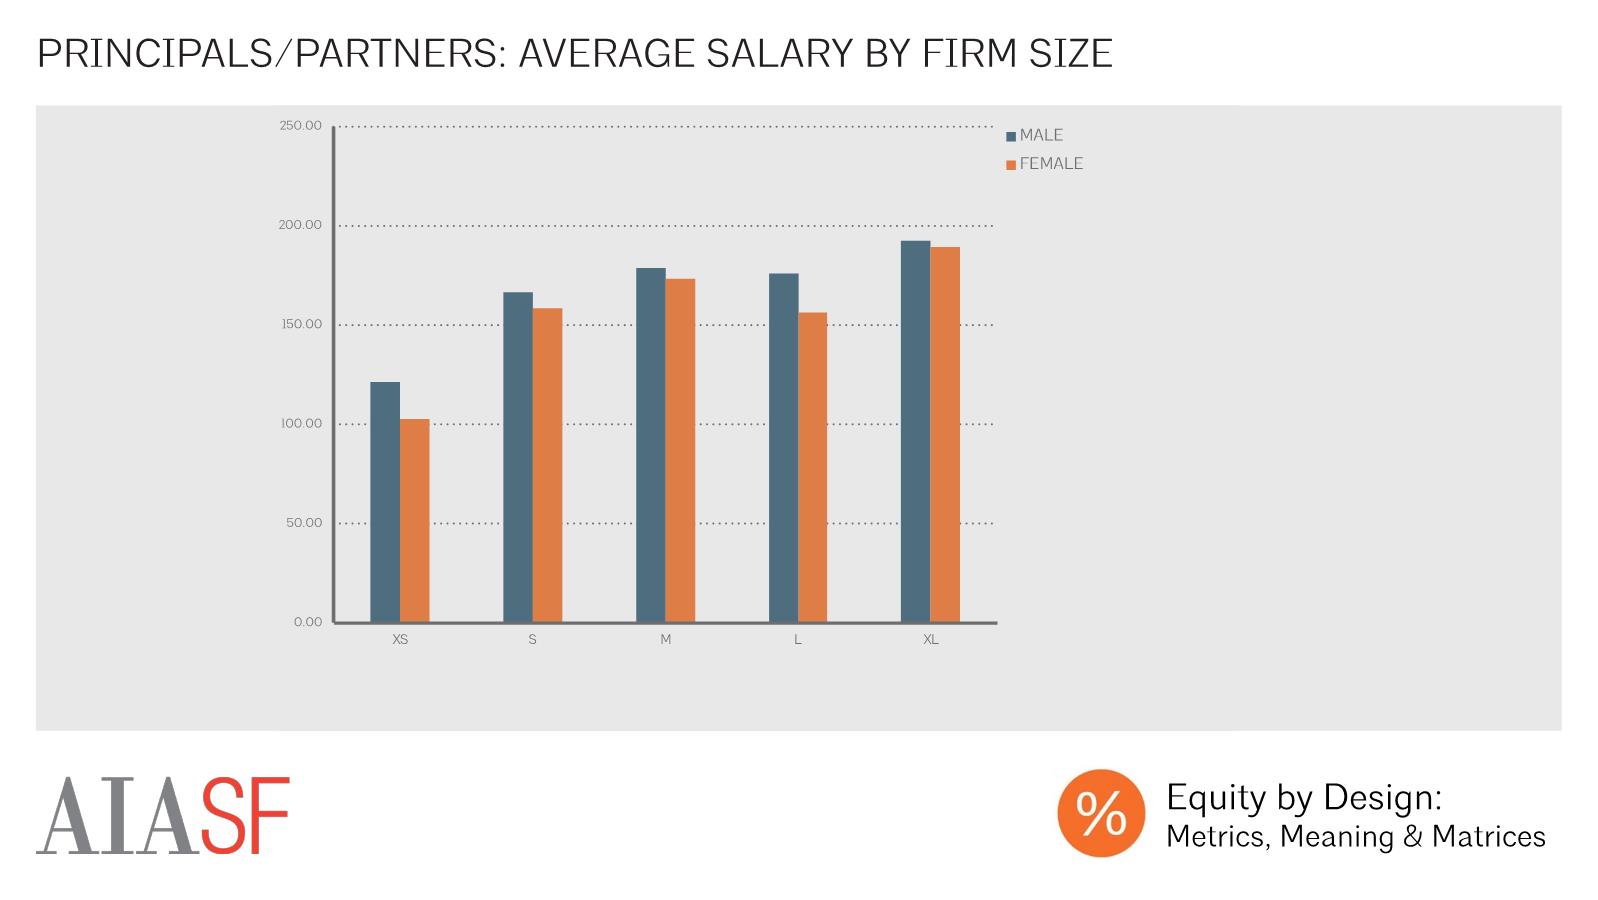
Principals/Partners: Average Salary by Firm Size
Male principals made more, on average, than female principals in every firm size. These differences were at their starkest in XS firms, even though female partners working in these firms owned more, on average, of their firms than their male counterparts.
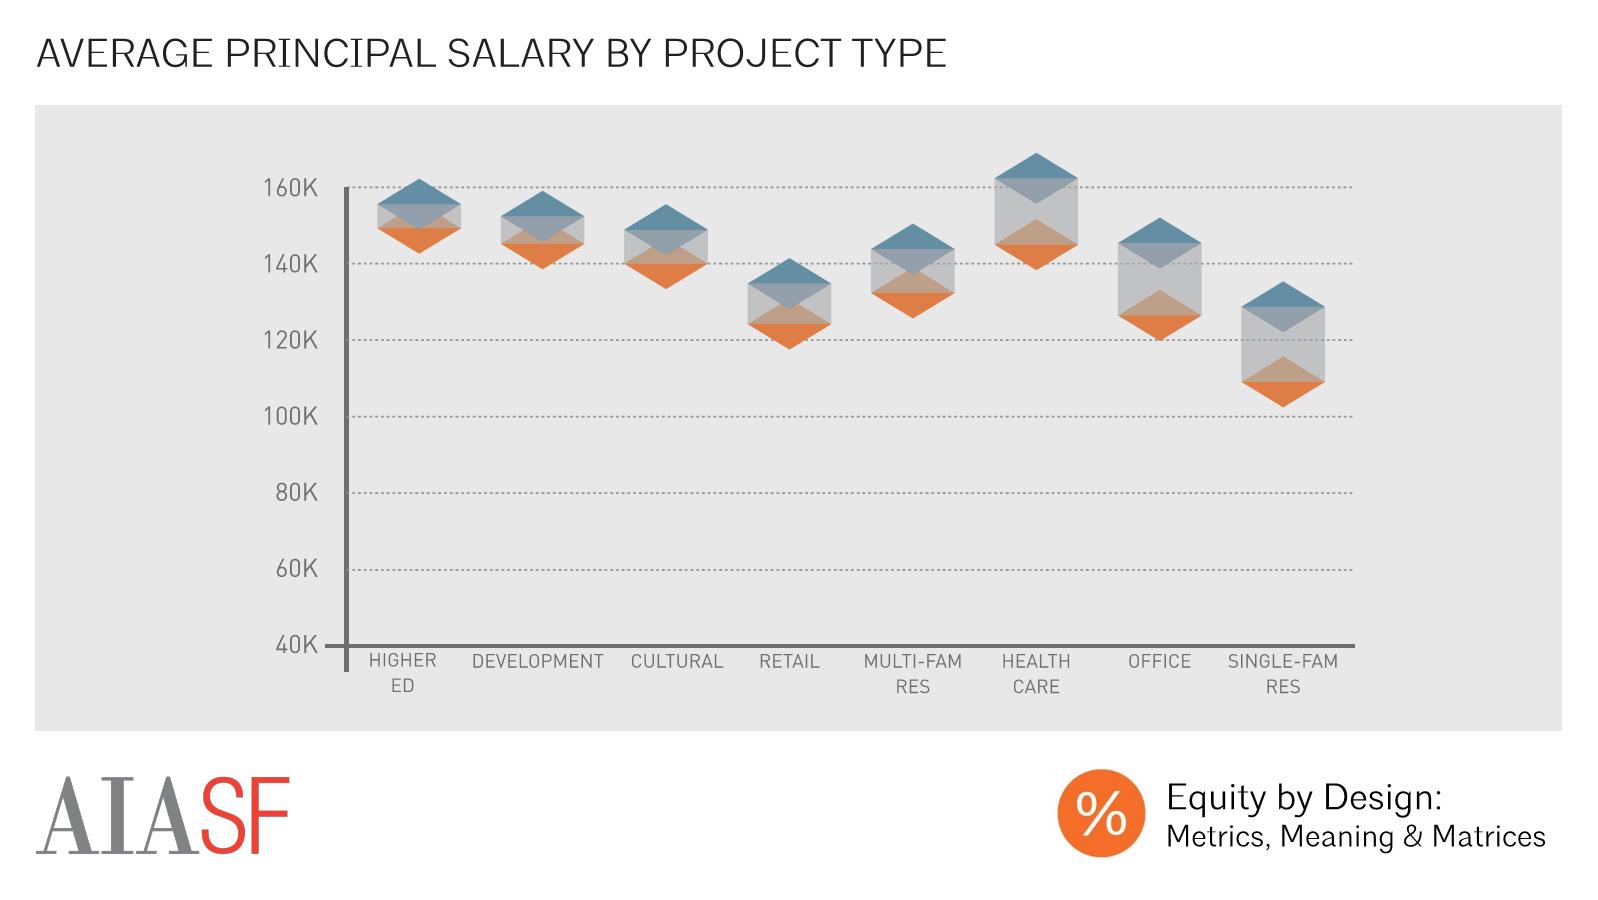
Average Principal Salary by Project Type
Amongst principals and partners, there was also a salary gap that varied by building type. The smallest gap existed between male and female partners working on higher education projects, with male partners making $6,000 a year more, on average than their female counterparts. Meanwhile, male partners working in healthcare earned $17,000 more, those designing corporate offices earned $19,000 more, and those designing single family residential projects earned $20,000 more

Metrics of Success by Leadership Title
Principals and partners -- both male and female -- had more positive career perceptions on average than those who were not principals in their firms. Non-principals were less likely to plan to stay in their current jobs, less likely to feel involved in the decision-making process, and less energized at work than those who were principals or partners. Among principals and partners, there were not significant differences between respondents’ career perceptions on the basis of race or gender, with one exception -- female partners’ perceptions of their work-life flexibility were 13% less positive than those of their male counterparts.

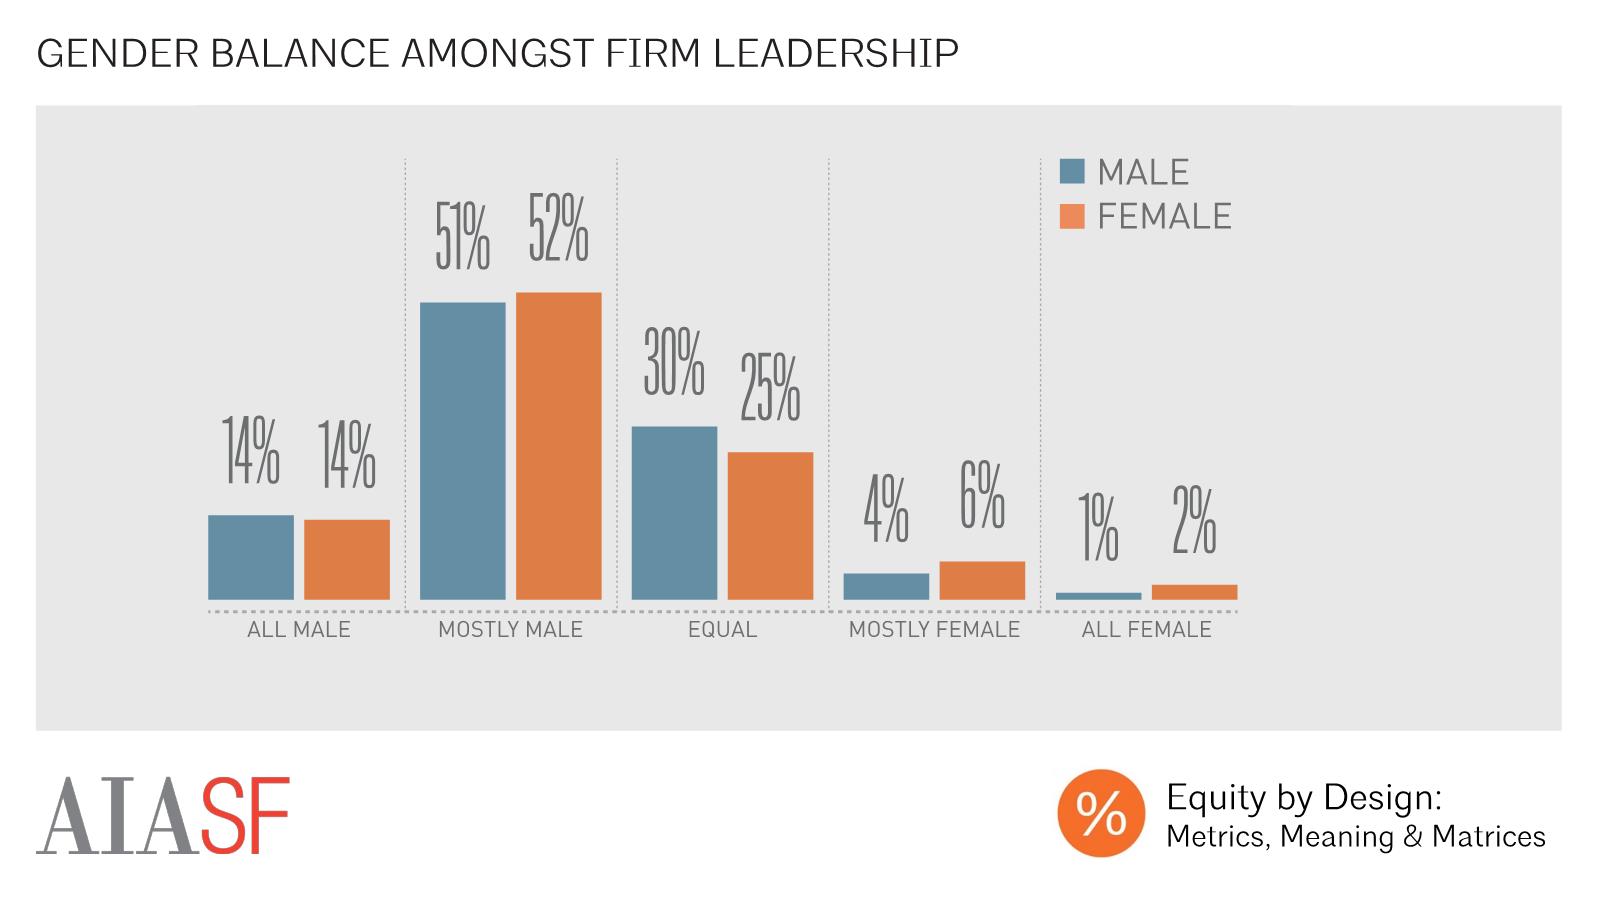
Gender Balance Amongst Firm Leadership
While 8% of our female respondents, and 5% of our male respondents, reported working in a firm that was mostly, or completely led by women, the majority of our respondents – male and female—reported working in a firm that was mostly or completely led by men.

Leadership Composition by Firm Size
Amongst male respondents, there was little variation in firm leadership composition on the basis of firm size. Amongst female respondents, however, those working in larger firms were much more likely to work in a firm that was majority male-led, with 73% of female respondents working in XL firms reporting that their firms are majority male-led, but only 52% of those working in XS firms reporting that their firms were majority male-led

Career Perceptions: All Male Led Vs. Equally Divided
Career perceptions varied significantly on the basis of firm leadership composition, with the most positive average perceptions reported amongst those working in firms with equally divided leadership. The strongest correlations were between leadership composition and career perception were in opinions of the promotion process. Compared to equally divided leadership teams, all male leadership teams’ employees had lower opinions of the promotion process (20% lower amongst women and 11% lower amongst men), lower opinions of firm culture (16% lower amongst women and 10% lower amongst men), and lower likelihood of sharing their firm’s values (13% lower amongst women and 5% lower amongst men).

Likelihood of Having Firm Leader as Mentor by Leadership Composition
Both male and female respondents were most likely to have a leader within their office -- either a principal or partner, or their direct manager -- to whom they could turn for career advice when they worked in offices with equally divided leadership (72% of men and 68% of women in equally divided offices).

Career Perceptions: Receives Guidance from Senior Firm Leader
This difference in access to leaders is significant because, compared to those who received no career guidance, those who turned to a senior leader within their firm for this type of advice were more more optimistic about their professional futures, more energized by their work, more likely to plan to stay at their current job. These correlations were stronger for female respondents with senior mentors than for male respondents.

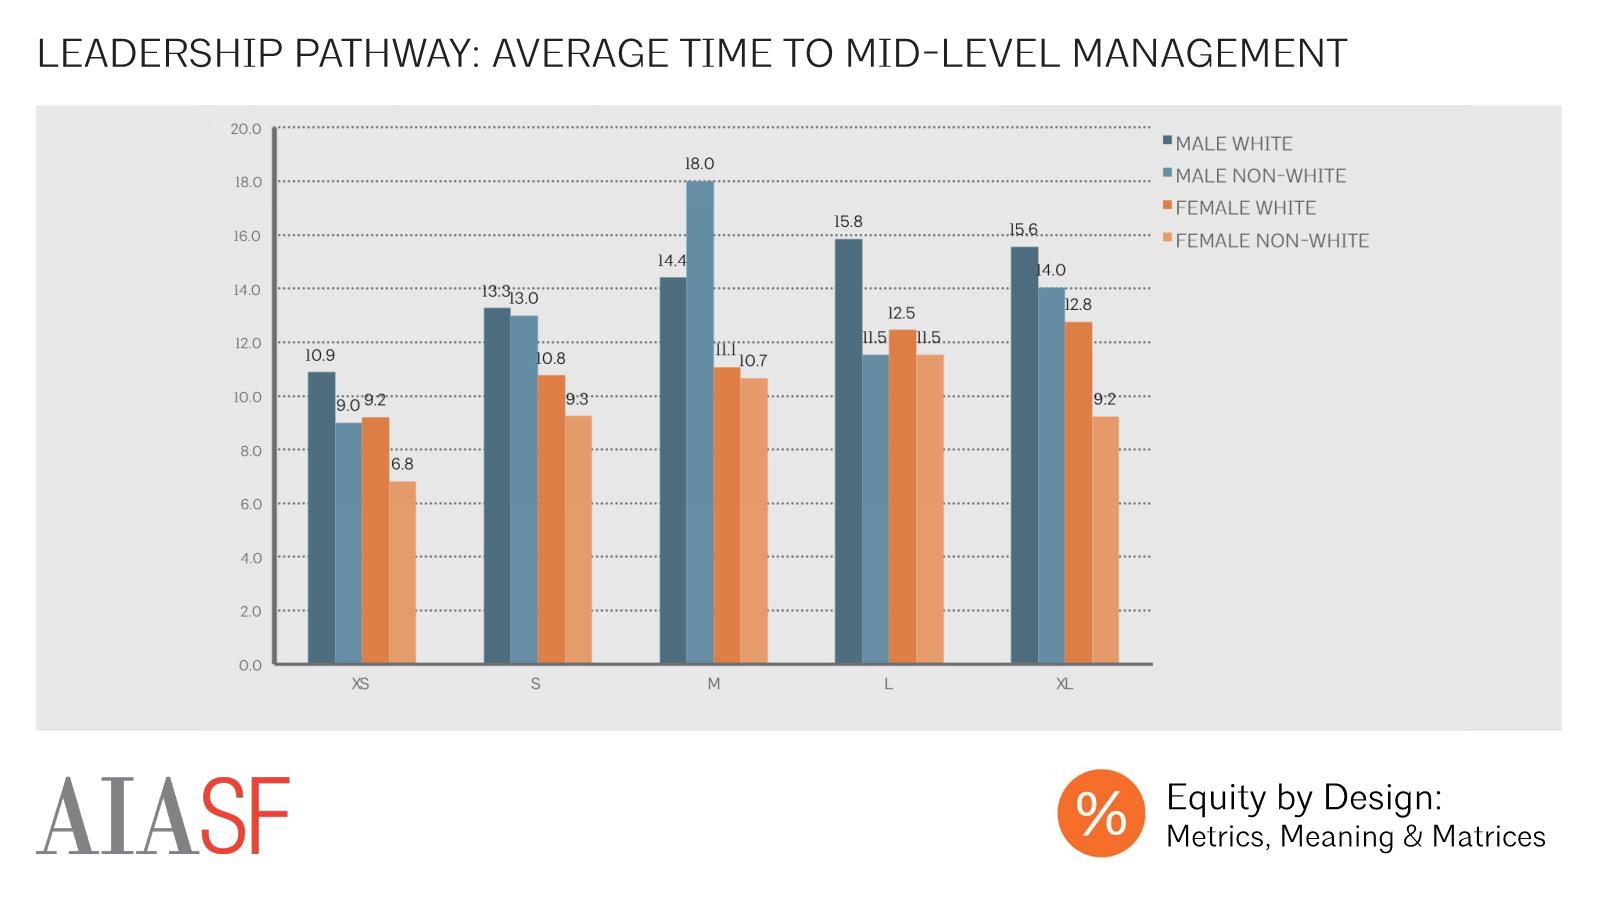
Current Leaders: Average Time to Mid-Level Management
Amongst those who had been internally promoted to a mid-level management position ( (i.e. tenure at firm exceeded amount of time as titled leader within that firm), women and people of color averaged similar or slightly lower levels of experience at time of promotion than white men. Regardless of race or gender, leaders of smaller firms had been promoted earlier in their careers, on average, than those who led larger firms. SEAONC’s SE3 project has shown that a similar phenomenon occurs within structural engineering.

Current Principals: Average Time to Principal
This trend also held true for those who had been internally promoted to a principal or partner position, with female and non-white principals and partners averaging equal or lower levels of experience at time of promotion in every firm size.

Average Time to Principal by Years Experience
These gender and race-based differences in time to leadership may be attributable to the lower average level of experience of our female and non-white respondents -- the average experience level of female principals in the sample was 10.4 years experience, while the average level of experience of male principals was 17.3 years of experience. Amongst principals and partners with comparable current levels of experience, we observed that male and female respondents reported similar levels of experience at the time of their promotion. There was insufficient data to produce meaningful analysis on this data point on the basis of race or ethnicity. These findings suggest that, while women and people of color are less likely to be promoted than their white male counterparts, those who do get promoted tend to get their position on timelines comparable to those of white male firm leaders.
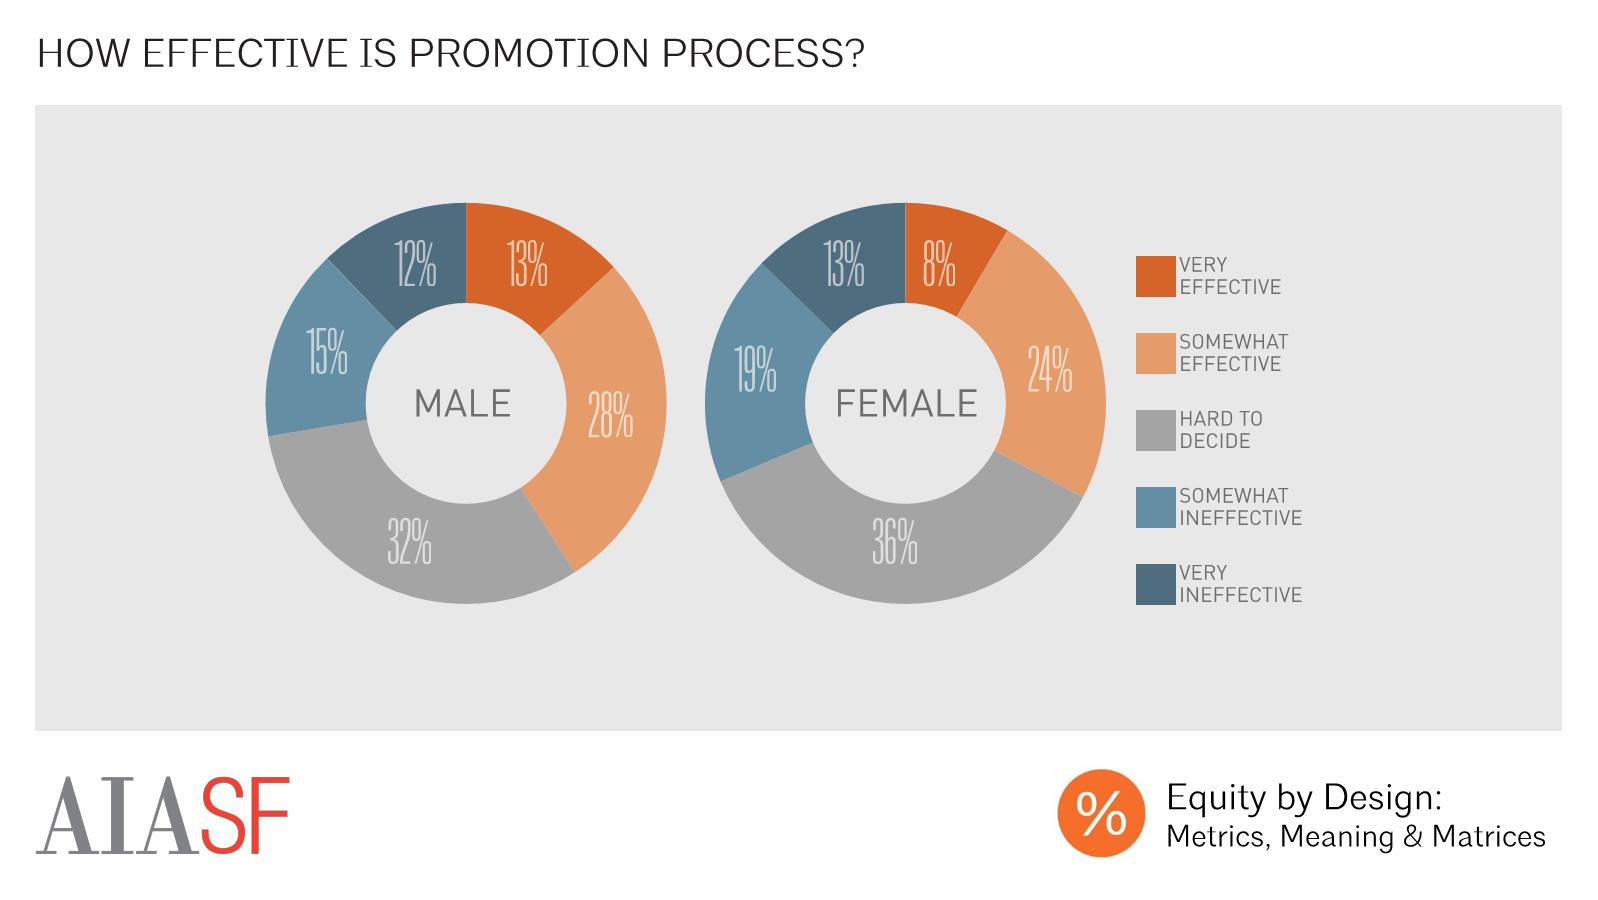
Perceived Efficacy of Promotion Process
Given female and racial and ethnic minorities’ underrepresentation in leadership within firms, and the gender differences that we saw between male and female partners’ experiences, we were interested to see our respondents’ opinions of their firms’ promotion processes. We saw that both male and female respondents had relatively low opinions of the effectiveness of these processes, with only 41% of men, and 32% of women describing this process as “very” or “somewhat effective

Efficacy of Promotion Process by Firm Size
The smaller the firm, the less likely a respondent was to find their firm’s promotion process “very” or “somewhat effective” (31% of those in XS firms vs. 41% of those in XL firms).
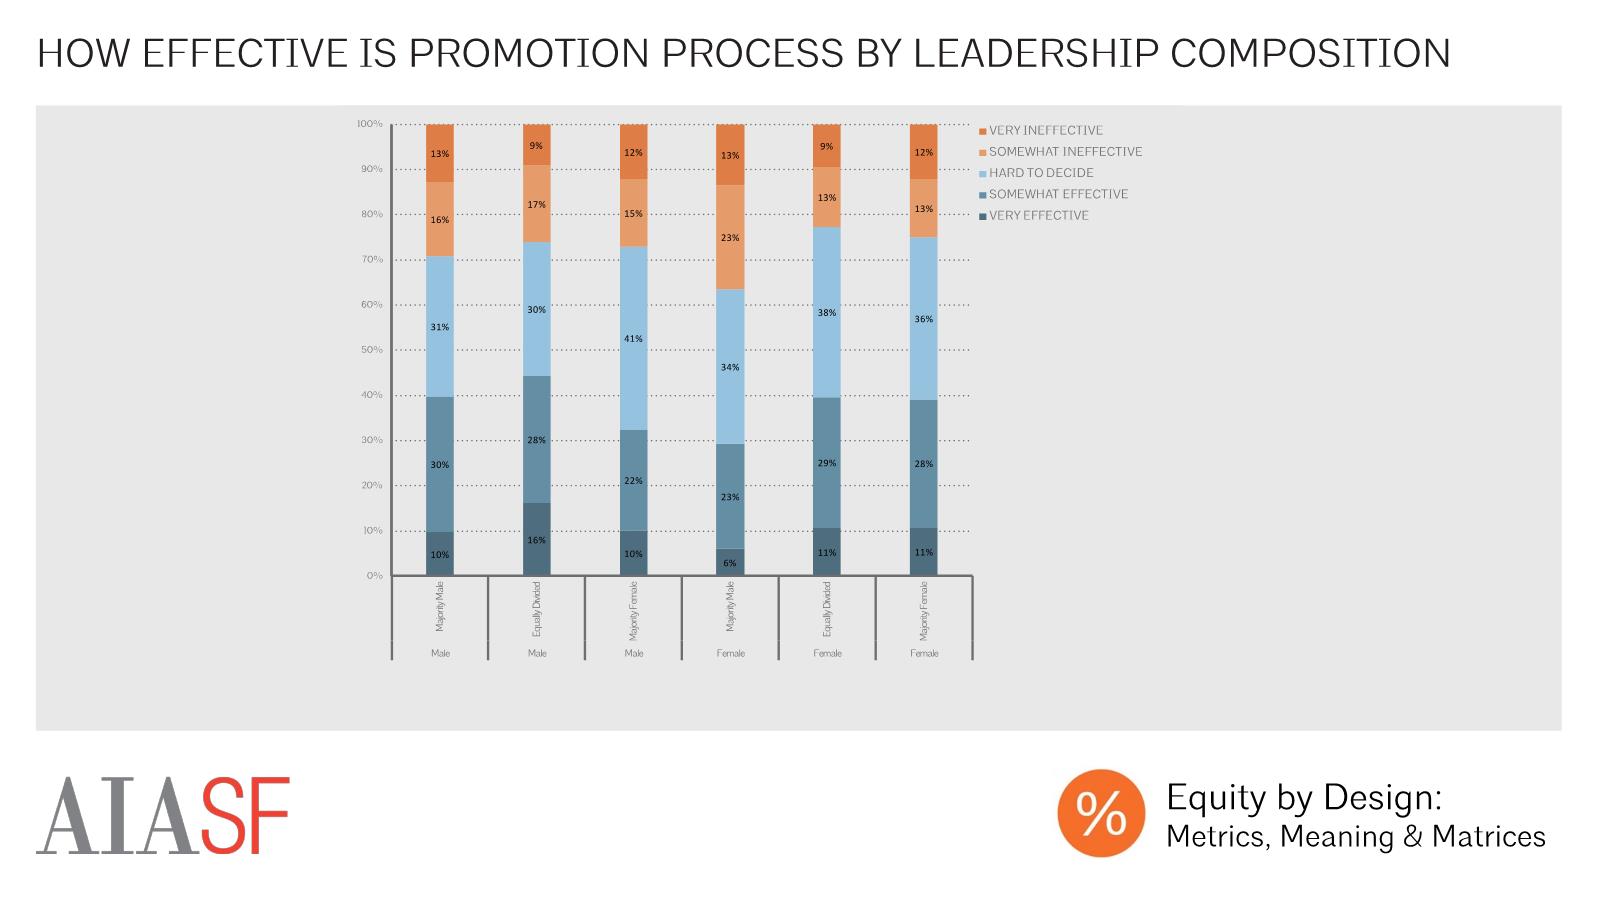
Efficacy of Promotion Process by Leadership Composition
Meanwhile, those working in firms with equally divided leadership composition -- both male and female -- were most likely to find their firm’s promotion process to be effective. Men working in majority female-led firms, and women working in majority-male led firms were least likely to believe that their firms’ promotion processes were effective.
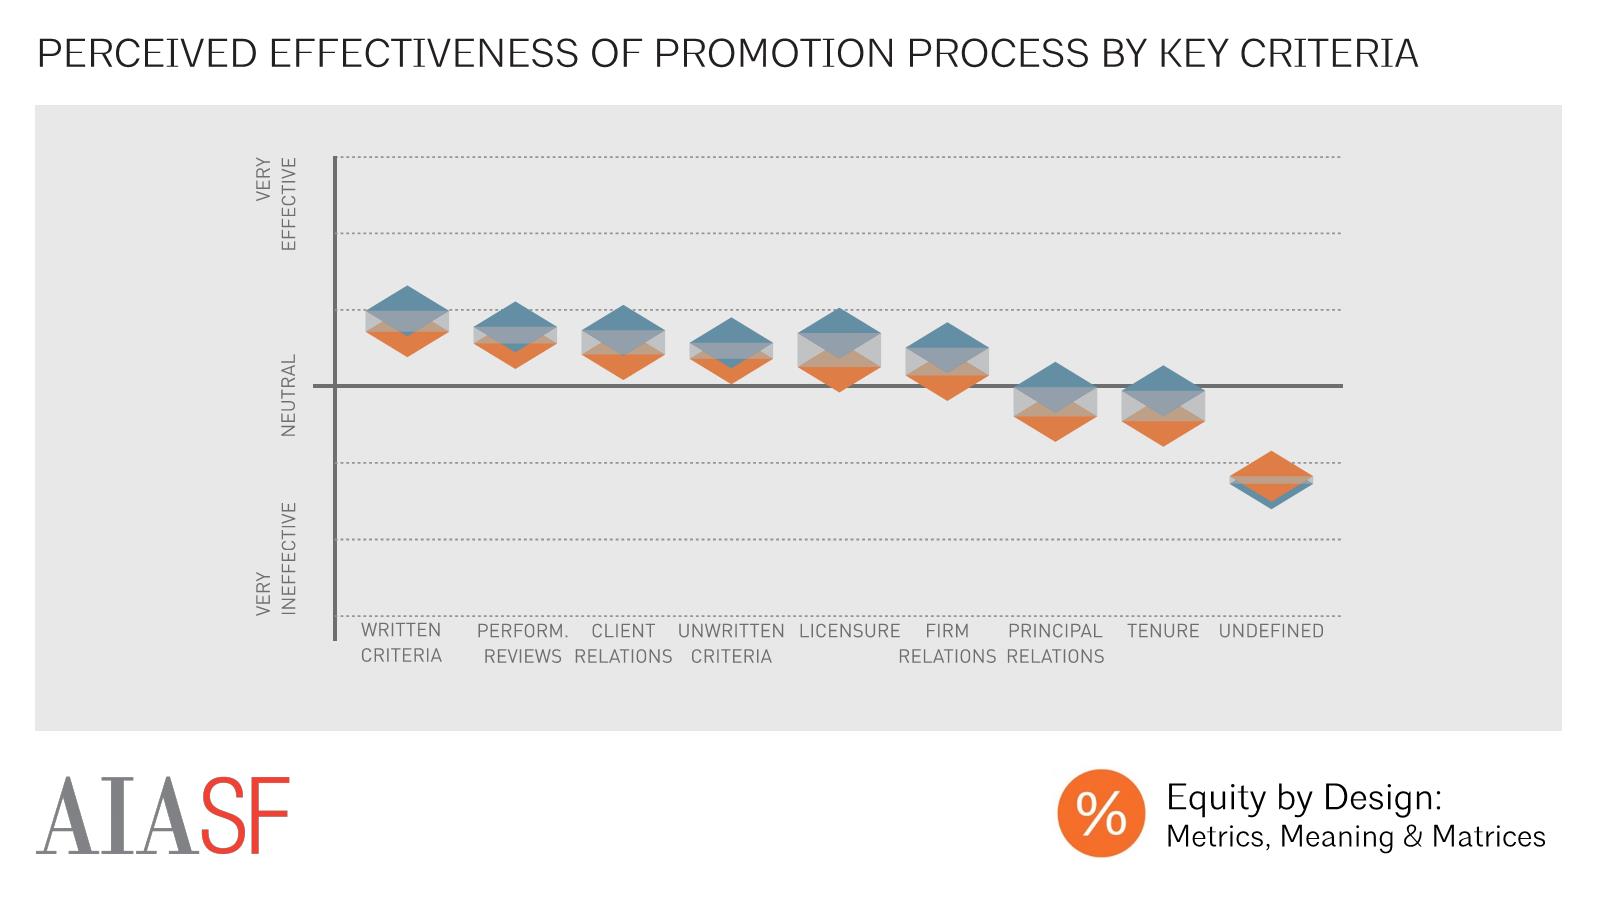
Perceived Effectiveness of Promotion Process by Key Promotion Criteria
We did see strong correlations between perceptions of the promotion process and firms’ top criteria for promotion, with those whose firms used written criteria, performance reviews, or client relationships to determine promotion more likely to have positive views of the process, and those whose firms used principal relationships, tenure, or unclear or undefined criteria less likely to view the process as effective.

Probability of Aspiring to Principal/Partner by Experience
Male and female respondents reported different career aspirations, with male respondents more likely than their female counterparts to report aspiring to be a principal or partner -- either through promotion or by starting a firm of their own -- at every point in their careers. We also noticed that those earlier in their careers were much more likely than those with more experience to report these aspirations.
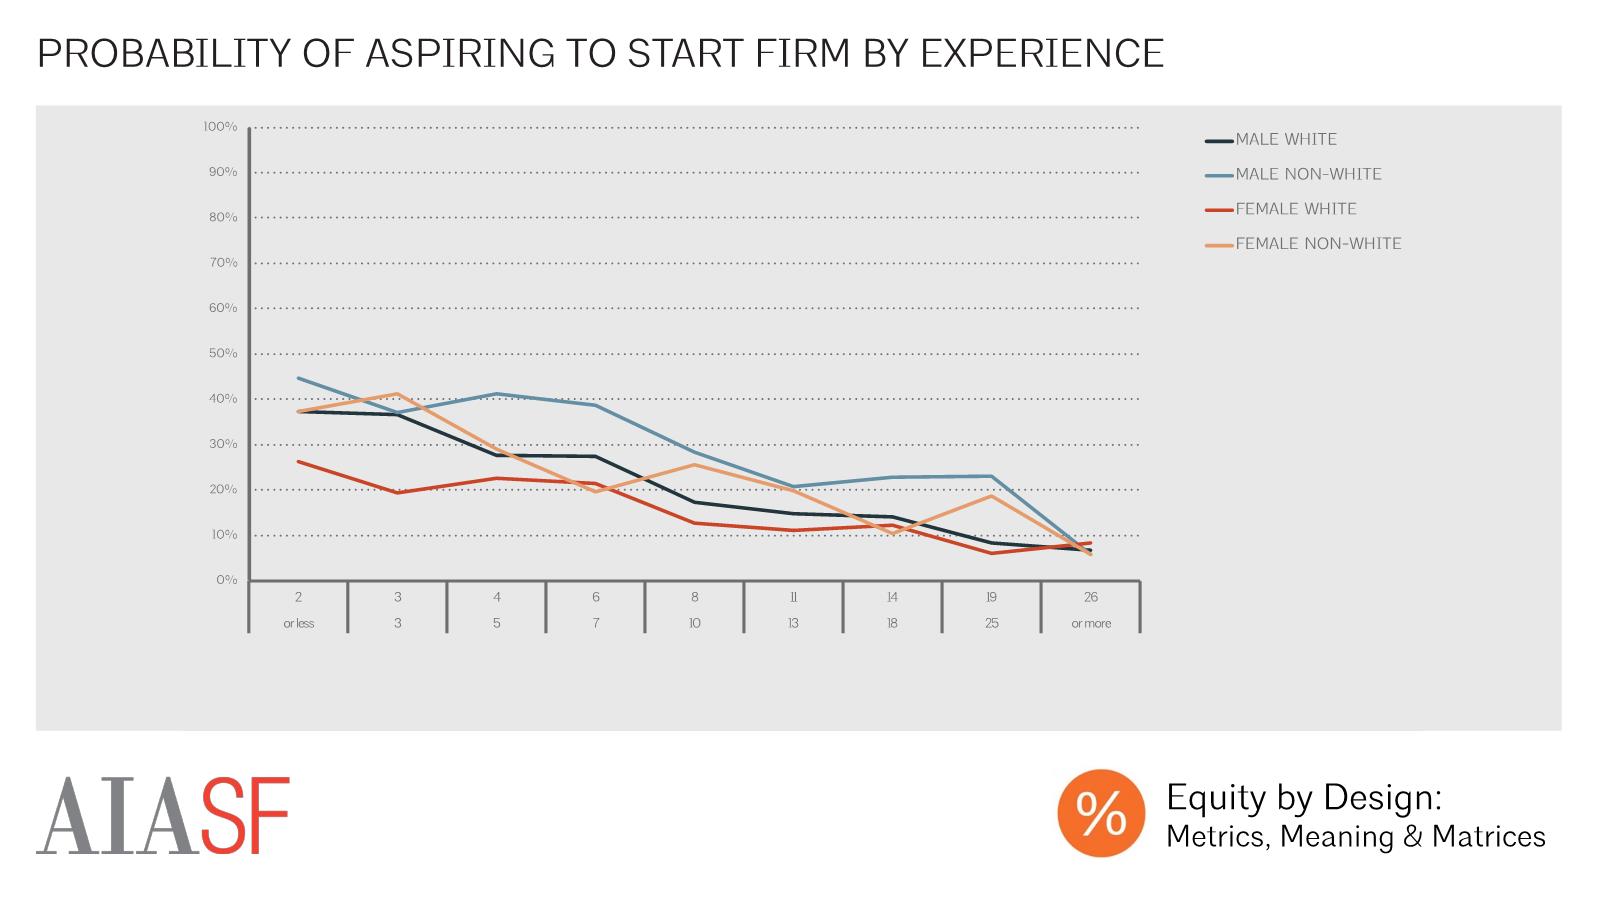
Probability of Aspiring to Start Firm by Experience
There were significant differences in how a respondent aspired to become a principal or partner on the basis of race, gender, and experience level. Those earliest in their careers, and especially men early in their careers, were most likely to aspire to start their own firm one day. At nearly every level of experience, non-white respondents of both genders were more likely than their white counterparts to aspire to start their own firm.

Probability of Aspiring to Principal/Partner via Promotion by Experience
White respondents, meanwhile, were more likely than non-white respondents to aspire to be promoted to be partner within an existing firm. White male respondents were also more likely than female and non-white male to aspire to become a principal or partner within an existing firm at every level of experience. Amongst white women, those with 8-10 years of experience were most likely to aspire to be promoted to a principal or partner position, with declining levels of aspiration amongst those in each subsequent experience bracket. Meanwhile, white male respondents with 11-25 years experience sustained high likelihoods of aspiring to be promoted to top leadership positions. While they were less likely than white respondents to aspire to be promoted to principal or partner, non-white respondents of both genders shared white male’s pattern in terms of experience level -- those in the middle of their careers were more likely than both those beginning their careers and more seasoned professionals to aspire to be promoted to a principal or partner position. This suggests that, while white female respondents’ likelihood of aspiring to be promoted to a top leadership positions peaked before they had achieved the level of experience at which these promotions tended to be occur (16 years median for female respondents), white male respondents had a high likelihood of aspiring to these promotions throughout the entire career window in which these promotions were made. Meanwhile, non-white respondents were less likely to aspire to these promotions at nearly every level of experience, instead tending to direct their aspirations towards starting their own practices.


