2016 Equity in Architecture Survey - Findings
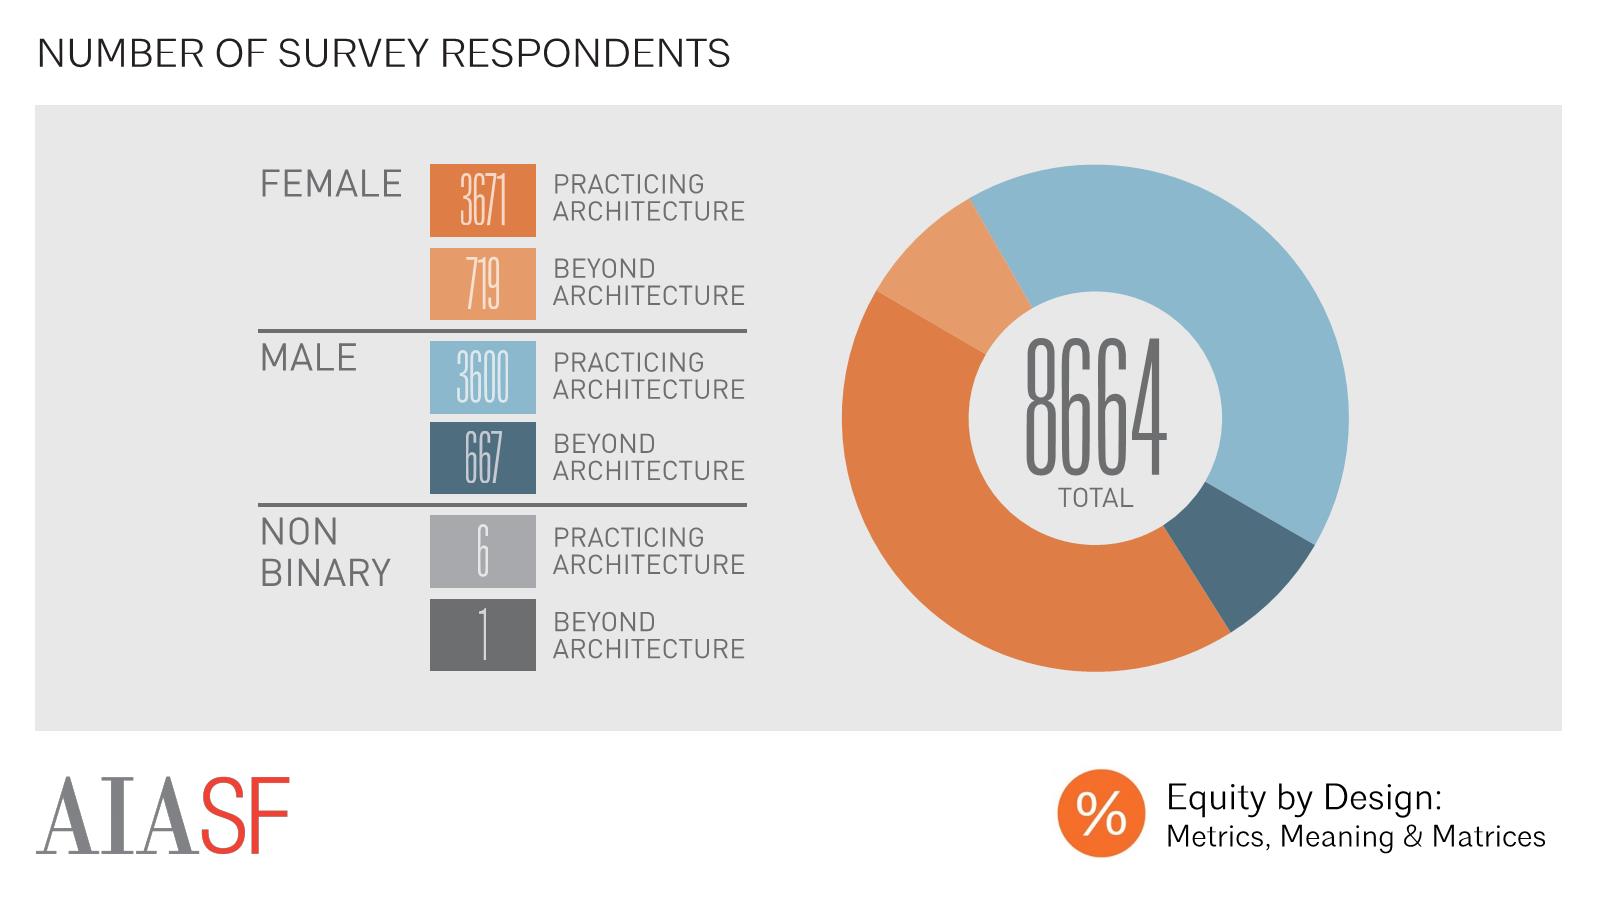
Overall, 8,664 respondents participated in the survey, making this the largest survey ever conducted on the topic of equity in architecture in the U.S. Of our 8,664 survey responses, roughly 50% identified as female, and 50% identified as male. We also had a small number of respondents (<1%) with non-binary genders. The non-binary gender sample was too small to allow us to conduct statistically valid analysis on this group on the basis of gender. We hope to over-sample this population in the future in order to be able to conduct more meaningful analysis on this group’s experiences. By comparing this to data from the AIA Firms Survey Report, we can see that the 2016 Equity in Architecture Survey over-samples women, who make up only 31% of architectural staff in AIA member-owned firms.
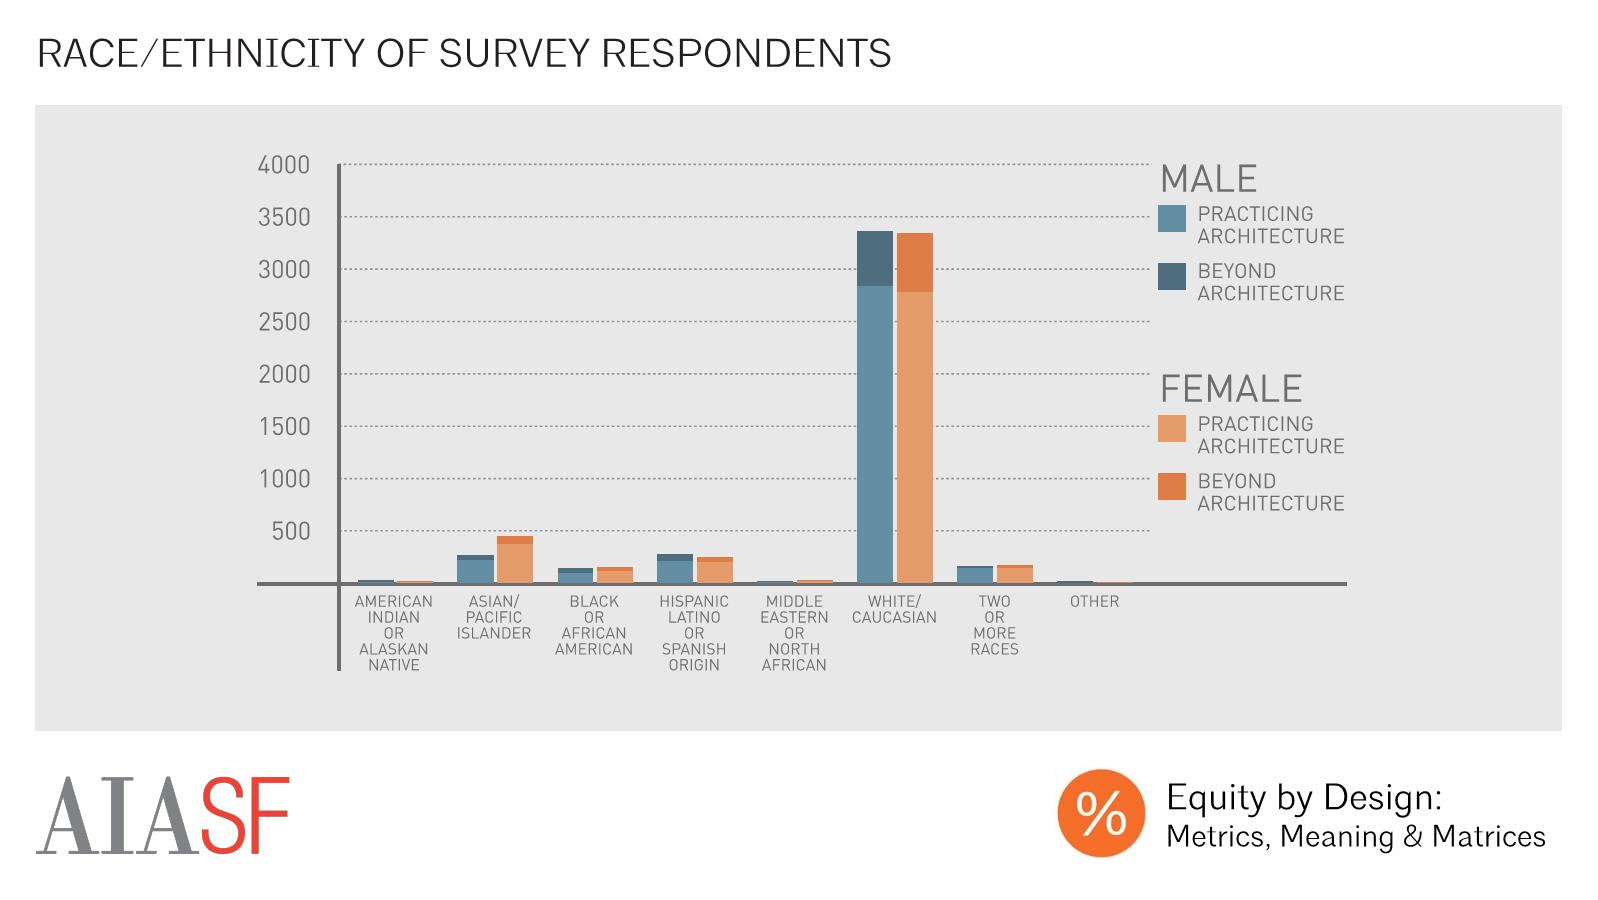
While we had a relatively even gender representation in our respondent pool, there was little racial or ethnic diversity, with 78% of respondents describing themselves as “white or caucasian.” According to the 2016 AIA Firm Survey Report, approximately 21% of the architectural staff working in AIA member-owned firms are people of color, suggesting the the 2016 Equity in Architecture Survey sample is fairly representative of the racial and ethnic diversity of AIA member-owned architectural firms. While the sample was representative as a percentage of the field, this also meant that it was quite small compared to the sample of the white population. This sample size, coupled with high degrees of response variability within this population, made drawing statistically valid conclusions on the basis of individual racial or ethnic group impossible for most questions due to insufficient sample size. In future rounds of study, we hope to gather more responses from people of color in order to be able to better understand equity issues as they relate to individual racial and ethnic groups.
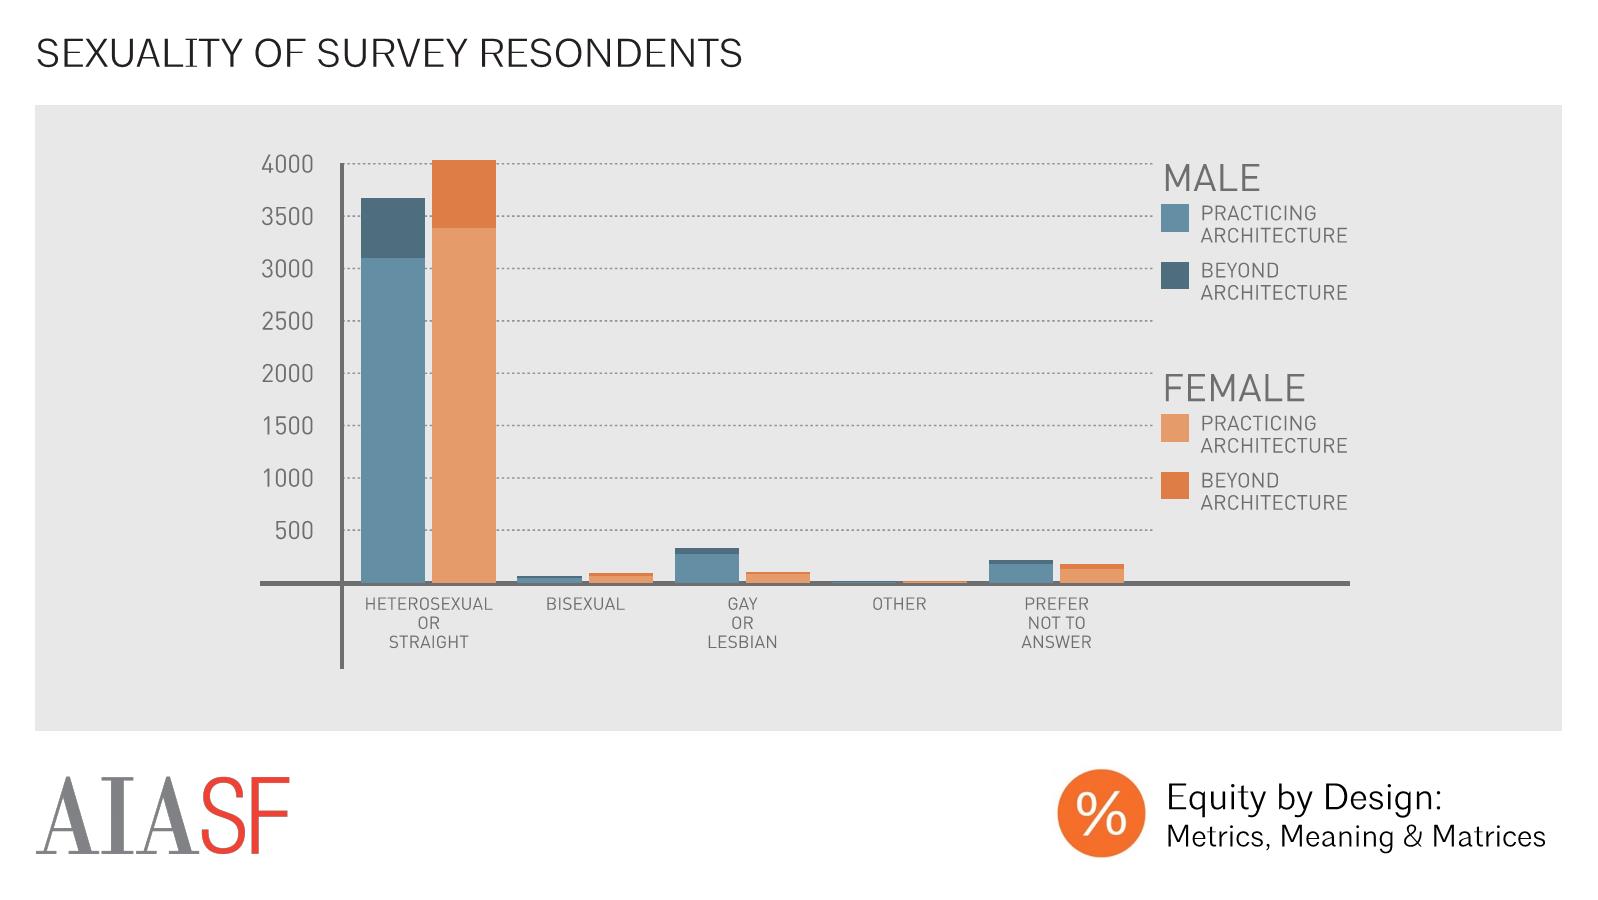
The survey population also had little diversity in terms of sexual orientation, with 86% of male respondents, and 92% of female respondents, identifying as straight, or heterosexual. The datasets that we typically use to understand the demographics of the profession -- including those from NAAB, NCARB, and the AIA -- don’t include statistics on the sexual orientations of architectural practitioners, so we can’t make any conclusions about how our sample compares to the architectural community on this issue.
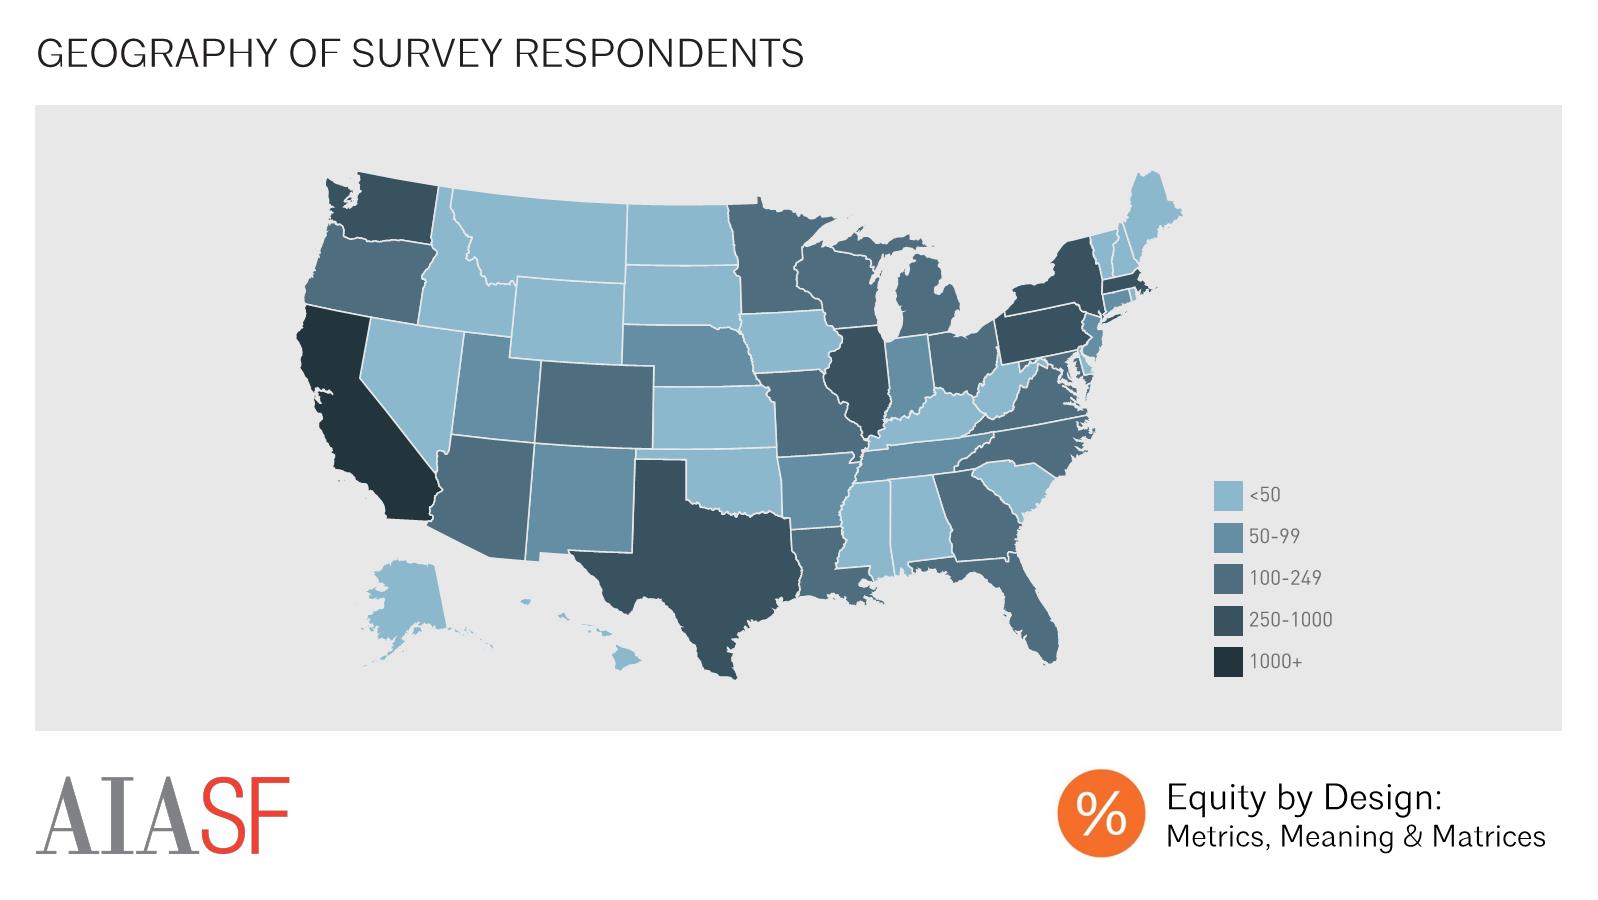
Our respondents’ geographic location was also fairly representative of the distribution of architectural professionals in the country, with heavy concentrations of respondents in states like California, New York, and Illinois. Overall, we received survey responses from all 50 states, as well as from foreign countries on six continents.
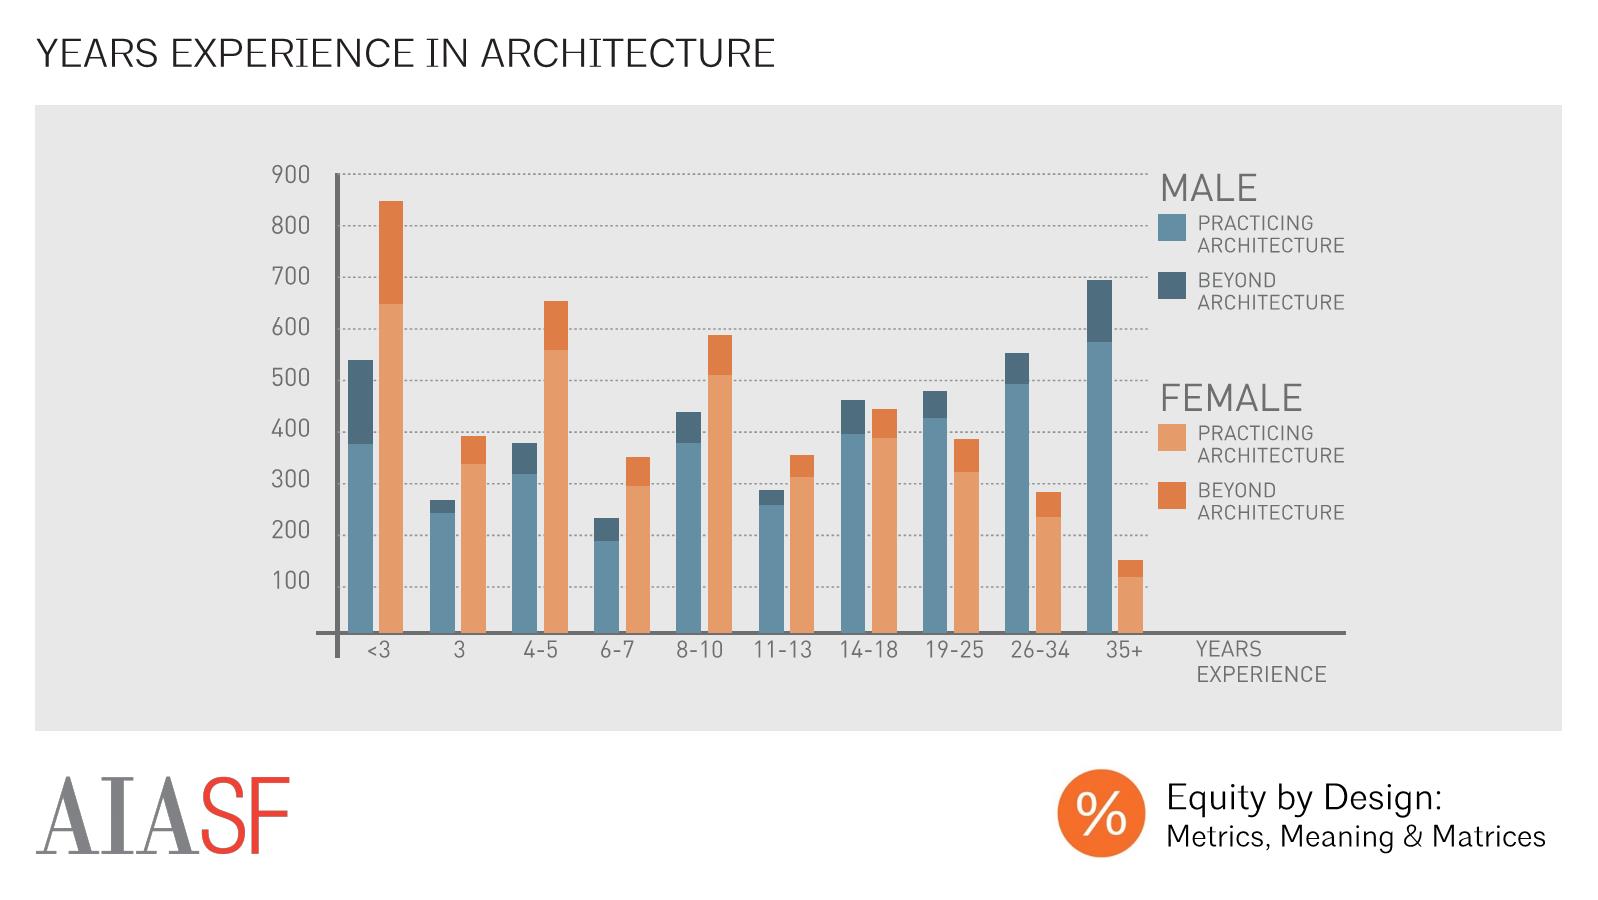
There was an interesting pattern in the experience level of our respondents. While the majority of our less experienced respondents were female, the majority of our respondents with more than 14 years of experience were male. In some ways, this is representative of what’s been called the “pipeline problem” in architecture. For instance, men were much more likely than women to have graduated from architecture programs 25 years ago, and so it makes sense that there are many more men than women with 25 years of experience today. For practical purposes, though, this means that it’s very hard to simply compare men to women in our results without also introducing confounding age and experience-level-related distinctions. That’s part of why you’ll see that we often analyze variables like salary by both gender and years of experience.
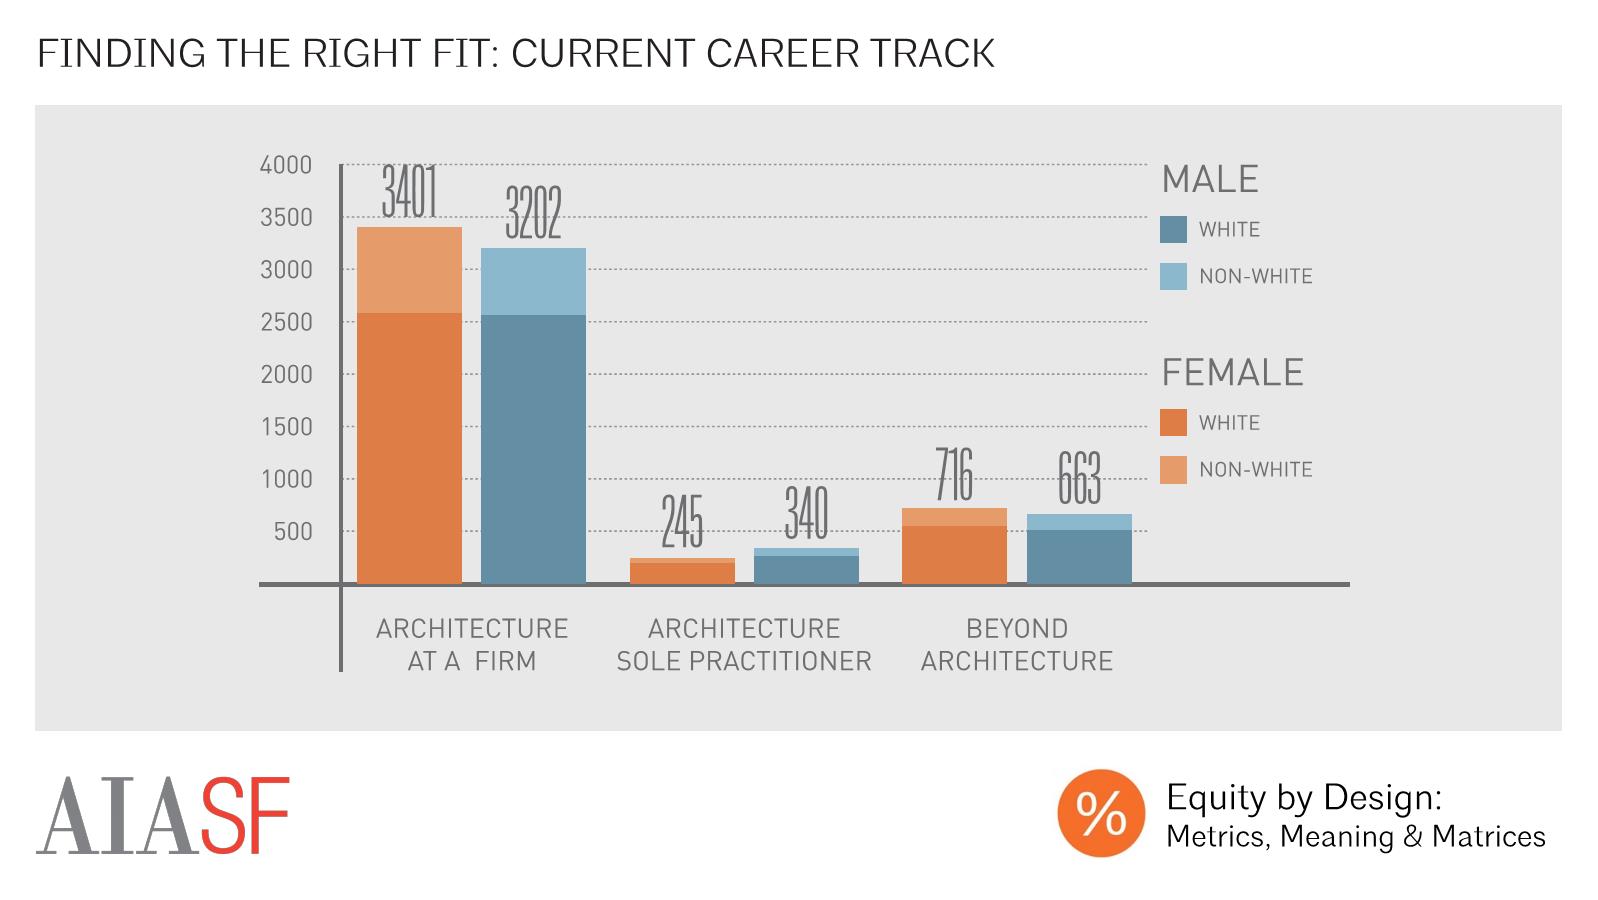
Because our study sampled architecture school graduates, not all respondents were currently working in architecture firms. The majority - 84% of all respondents - were currently practicing architecture, either within a firm or as a sole practitioner. There weren’t significant differences in respondents’ likelihood of practicing architecture on the basis of either race or gender. There were, however, differences in work setting amongst those who practiced architecture. For those practicing architecture, a firm was the most common work setting. This was especially true for women of color, who were only half as likely (4%) as either white men (8%) or men of color (8%) to work as a sole practitioner. In addition to those who were currently working in a firm or as a sole practitioner, we had a significant number of respondents who weren’t working in one of these settings, and may have been working in a related field or in another industry, providing full-time care for a family member, studying, unemployed, or retired. We have used the label "beyond architecture" throughout our analysis to identify this diverse population.


We found that the top three reasons that respondents accepted jobs were “quality of projects”, “learning opportunities”, and “firm reputation.”

Respondents tended to cite similar reasons for taking jobs, although women were slightly more likely to prioritize work-life flexibility, while men, and especially men of color, were slightly more likely to prioritize advancement opportunities. Respondents of color were more likely than white respondents to cite salary offered as a primary motivator in choosing their job.
White male respondents were the least likely of any group to report taking a position based on “learning opportunities.” This difference, however, is largely explained by the difference in median experience level between white male and other respondents, as those starting their careers were more likely to report taking their jobs to capitalize on learning opportunities.

Respondents reported working in firms ranging in size from sole proprietorships to large firms with over 1000 employees. The plurality of respondents worked in firms with fewer than 20 employees. Female respondents were more likely to report working in firms with fewer than 20 employees, while male respondents were more likely to report working in the largest firms.
Respondents’ firm size was strongly correlated with their top reasons for taking their current jobs, with those in the smallest firms most likely to say that they had taken their jobs because they afforded work-life flexibility and because they shared values with their firms. Those working in the largest firms, meanwhile, were significantly more likely than those working in small firms to report that they had taken their position because of their firm’s reputation, project quality, salary offered, and advancement opportunities. These patterns are mirrored in the lived experiences of employees, with those working in the smallest firms reporting the highest average satisfaction with their work-life flexibility. Meanwhile, average salaries were largest within the largest firms and those working in the largest firms tended to have the most positive impressions of their firms’ promotion processes.

There were also significant differences in firm size on the basis of race, with white, latinx, and multi-racial respondents most likely to work in firms with fewer than 20 employees. African American or Black respondents were slightly more likely to work in small and medium-sized firms, but had a similar overall distribution of firm sizes. Asian respondents, meanwhile, were most likely to work in medium firms, with 50-249 employees, and were also more likely than others to work in large and extra-large firms.

On average, male respondents’ career perceptions were more positive than those of their female counterparts. When asked about the relative positivity or negativity of their career perceptions across 14 categories from “work –life flexibility” to “promotion process ”to their likelihood of staying at their job for the next year,” male respondents’ average perceptions were more positive than female respondents’ in every category. The largest gender gaps indicated significant differences between men’s and women’s likelihood of feeling energized by their work (male respondents 7% more likely), likelihood of “having a seat at the table”, or being included in one’s firm’s decision-making process (male respondents 6% more likely), and likelihood of planning to stay in one’s current job for the next year (male respondents 6% more likely).
There were also areas of work-life that tended to be viewed more positively or negatively by all respondents: average perceptions of autonomy, satisfaction, and confidence tended to be most positive for respondents, while respondents’ average perceptions of their firms’ promotion processes, their work-life flexibility, and their workloads were least positive, on average. Male respondents perceptions were more positive, on average, than female respondents’ perceptions in each of these categories. We did not observe significant differences in career perceptions on the basis of race or ethnicity.
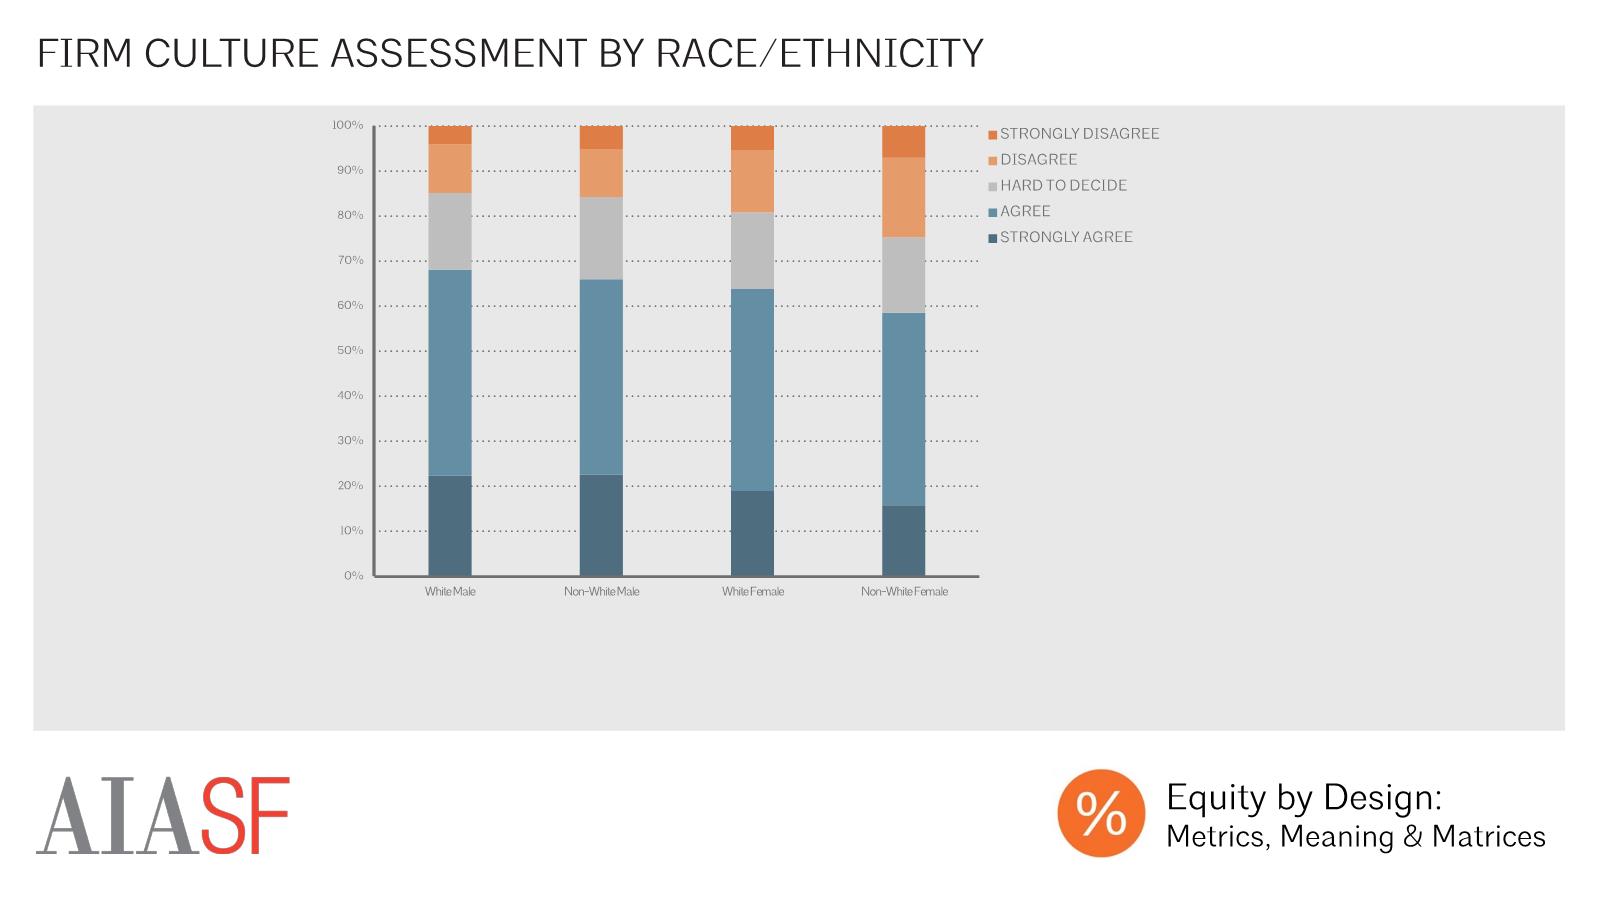
There were also significant differences in career perceptions in several areas on the basis of race as well as gender. White men were most likely to agree with the statement “I am satisfied with my workplace culture,” with men of color, white women, and women of color each successively less likely to agree with this statement.
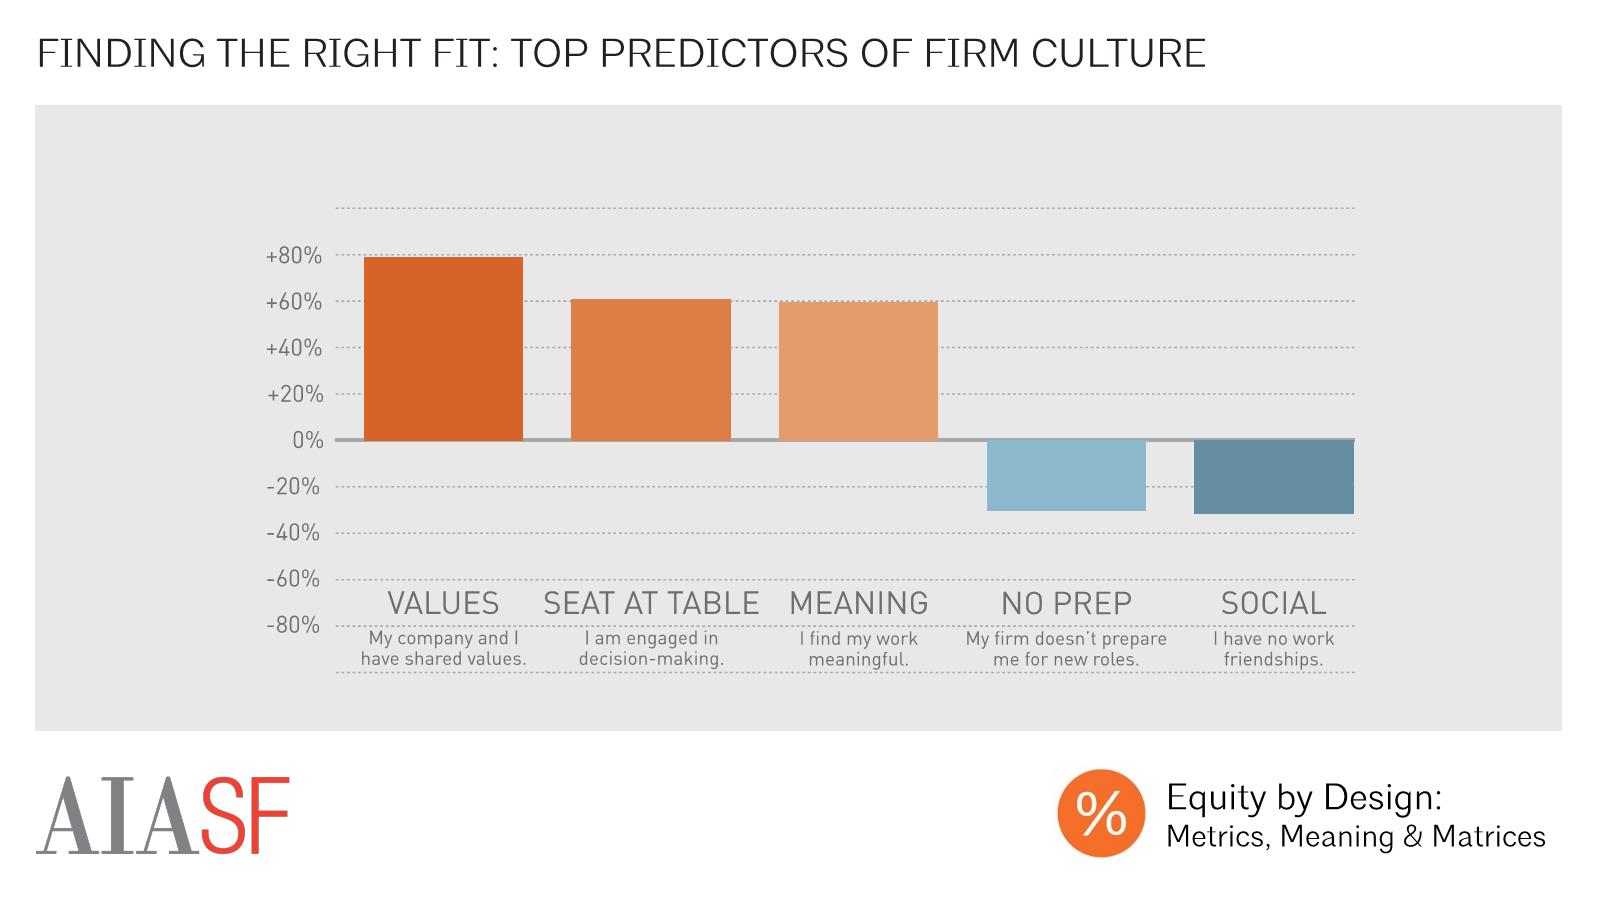
While workplace culture was viewed more negatively on average, by female respondents and by respondents of color, neither gender nor race were top predictors of whether a respondent had a positive assessment of their culture. Instead, the beliefs that a respondent shared values with their employer, that they were engaged in the decision-making process, and that they found their work meaningful and rewarding were associated with positive assessments of firm culture. Female and non-white respondents were less likely than white male respondents to agree with each of these statements. This suggests that equity issues are often multi-faceted, and that organizations must address equity holistically by looking beyond issues of representation to address issues of access, relationships, and culture.

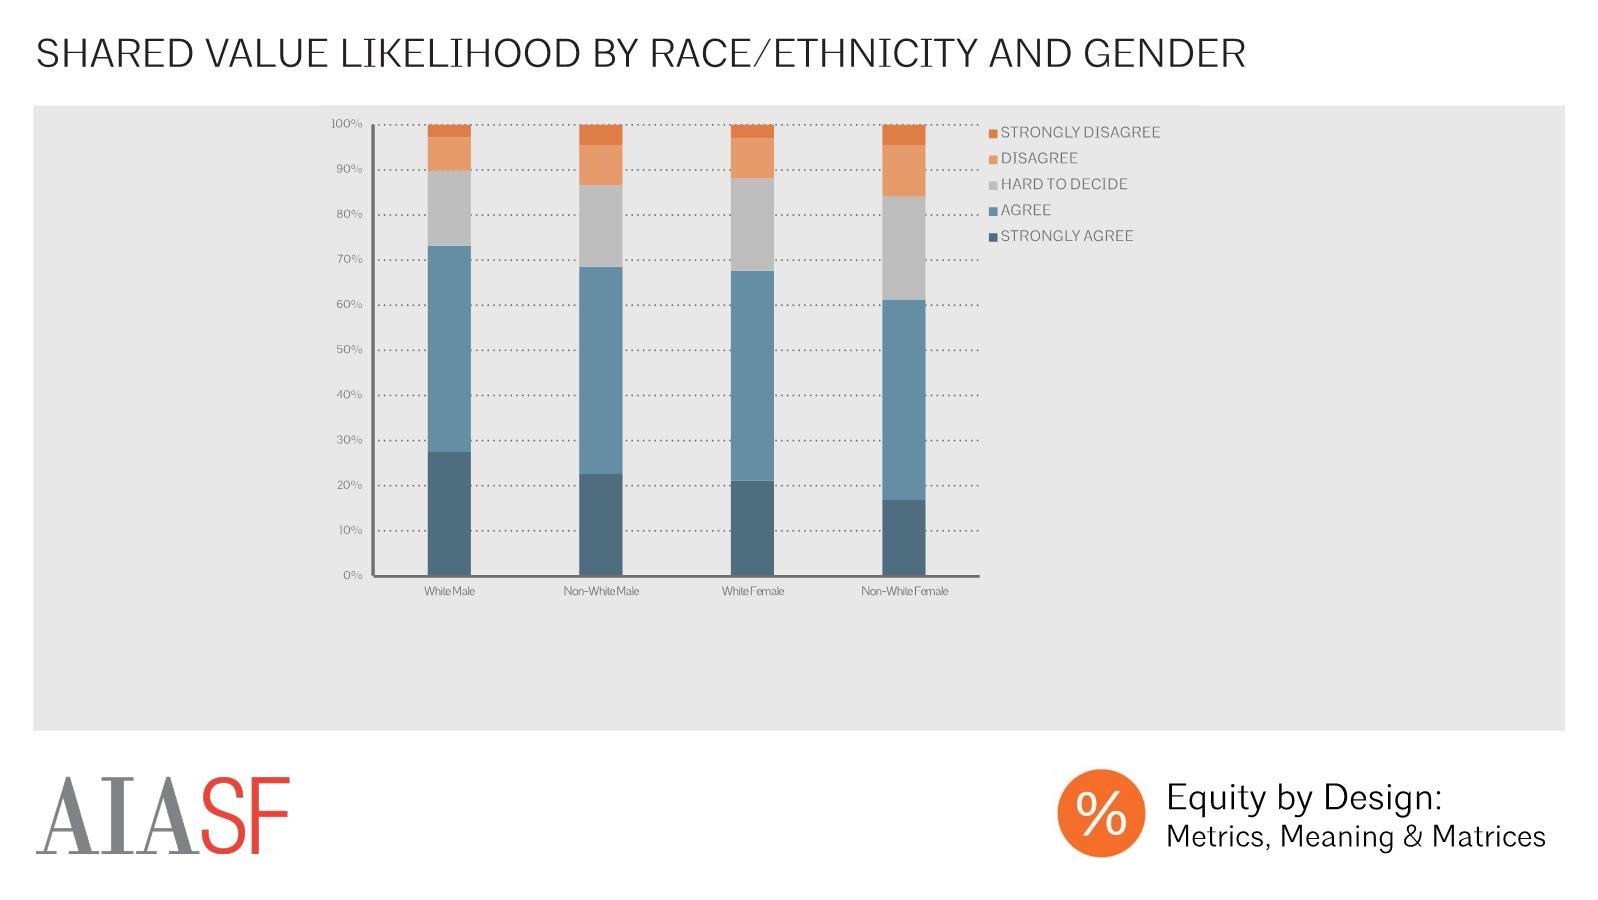
The top predictor of whether or not a respondent was satisfied with their workplace culture was the degree to which they agreed or disagreed with the statement “My values and my company's values are alike.” According to a study conducted by Michael Leiter and Christina Maslach, sharing values with one’s company also tends to be the greatest overall predictor of job-person fit, and whether an individual will stay with their current company and be engaged in their work. It’s unfortunate, then, that white male respondents were significantly more likely than others to report that they shared their companies’ values, with women of color least likely to agree with this statement.

Sharing values with one’s employer, meanwhile, was strongly correlated with a range of factors, with those who believed their day-to-day work was relevant to long term goals, those who received ongoing feedback about their work, those who received one-on-one coaching in preparation for new roles and responsibilities, and those who said that use of work-life benefits didn’t affect promotion within their firms most likely to agree that they shared values with their firm. Meanwhile, those who received no training, those without workplace friendships, and those who didn’t know their firm’s performance evaluation criteria were least likely to share values with their company. In short, those with strong, personalized relationships with peers and firm leadership were most likely to see an alignment of values.

Workplace relationships were one of the greatest predictors of workplace culture assessment, with respondents who said that they didn’t have any relationships at work reporting 30% more negative perceptions of their firm culture than those who had workplace friendships. Fortunately, the vast majority of respondents reporting having social relationships at work, with over 70% reporting that they ate lunch or took breaks with coworkers, just over half of respondents reporting that they socialized with coworkers outside of work, and nearly half of respondents reporting that they had close friendships at work. There were slight differences in reported workplace relationships, with women of color least likely to report socializing with coworkers outside of work, and significantly less likely than white women, but slightly more likely than men, to report having close workplace friendships.

Finally, a range of workplace culture initiatives were related to respondents’ perceptions of workplace culture, with respondents reporting that the most effective ways that their firms could promote workplace culture were by organizing social events, by providing space for taking breaks and eating lunch, and by sharing company goals and achievements with employees.

As Maslach and Leiter have shown, these firm culture initiatives and other efforts to keep employees engaged and happy are ultimately important because they impact employee retention. On average, respondents had been with their current firms for 6.8 years. This mean is significantly above the median tenure of three years with a firm, in part because 20% of respondents had been with their firms for 11 years or longer, which pushed the mean higher. Average tenure increased with experience level, with average tenure equalling about half of total years of experience in the field at most experience levels.

When asked why they had left their last jobs in the field, respondents cited “better opportunities elsewhere”, a “lack of advancement opportunities”, and “low pay” most frequently.

While average tenure with one’s current firm was relatively high, we also found that a large number of respondents were considering leaving their current jobs. Overall, we approximately 1 out of 4 respondents reported that they were either somewhat or very likely to leave their firms within the next year.
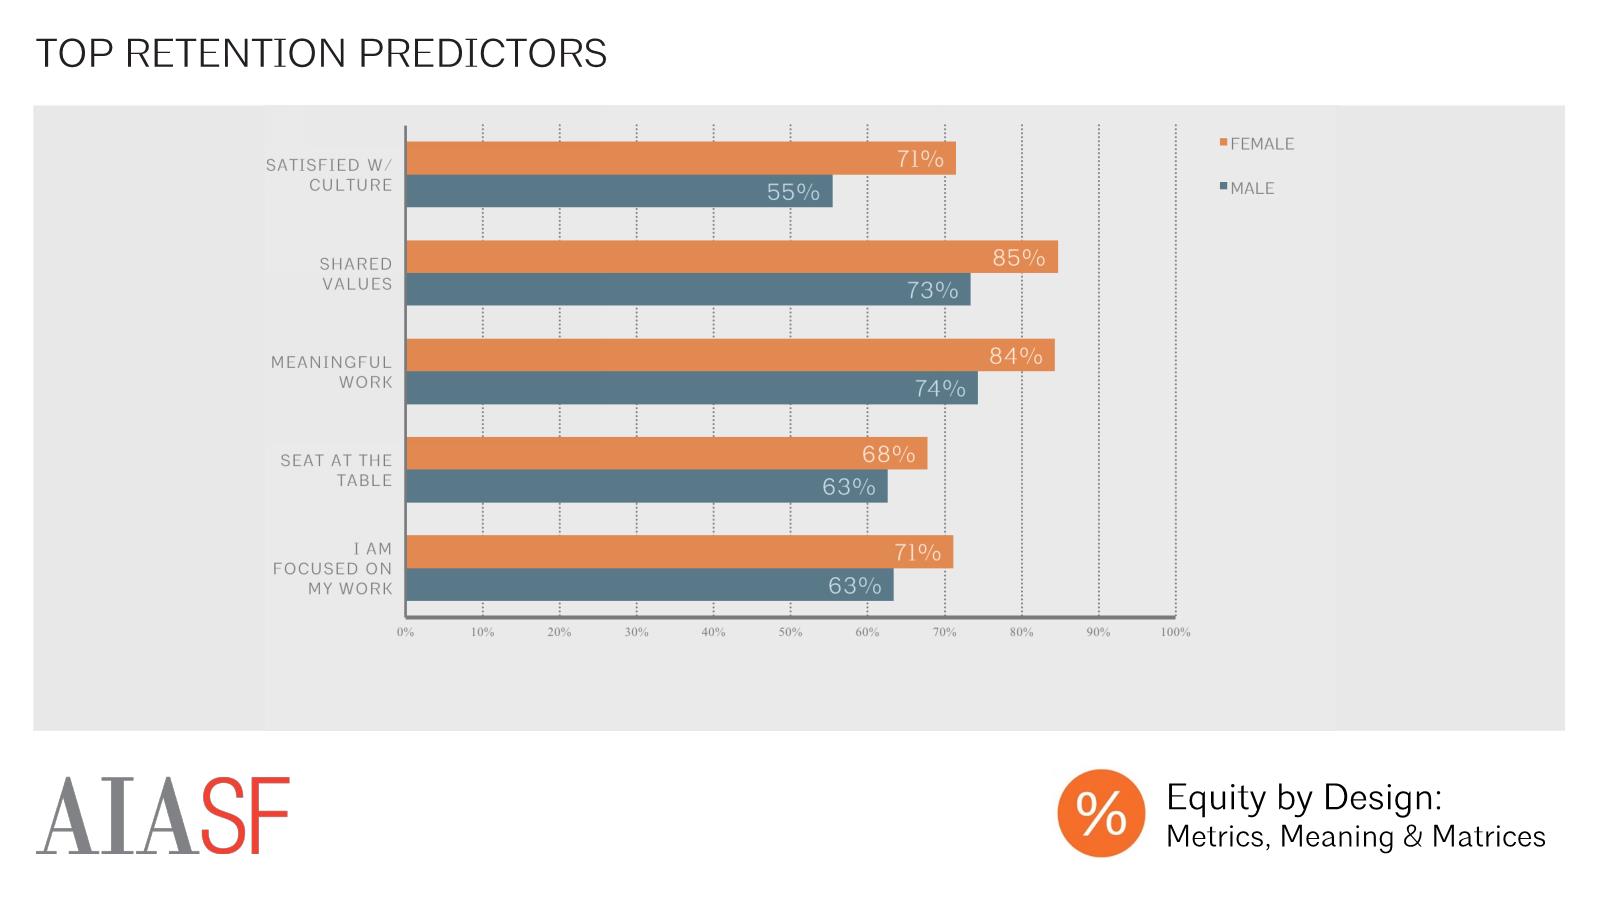
Several factors were strongly correlated with a respondent’s likelihood of planning to remain in their current position, with those who believed that their work was meaningful and rewarding, those who shared values with their company, those who reported feeling involved in their work, those who were given a seat at the table by being included in their firm’s decision-making process, and those who were satisfied with their workplace culture most likely to plan to stay in their current position.
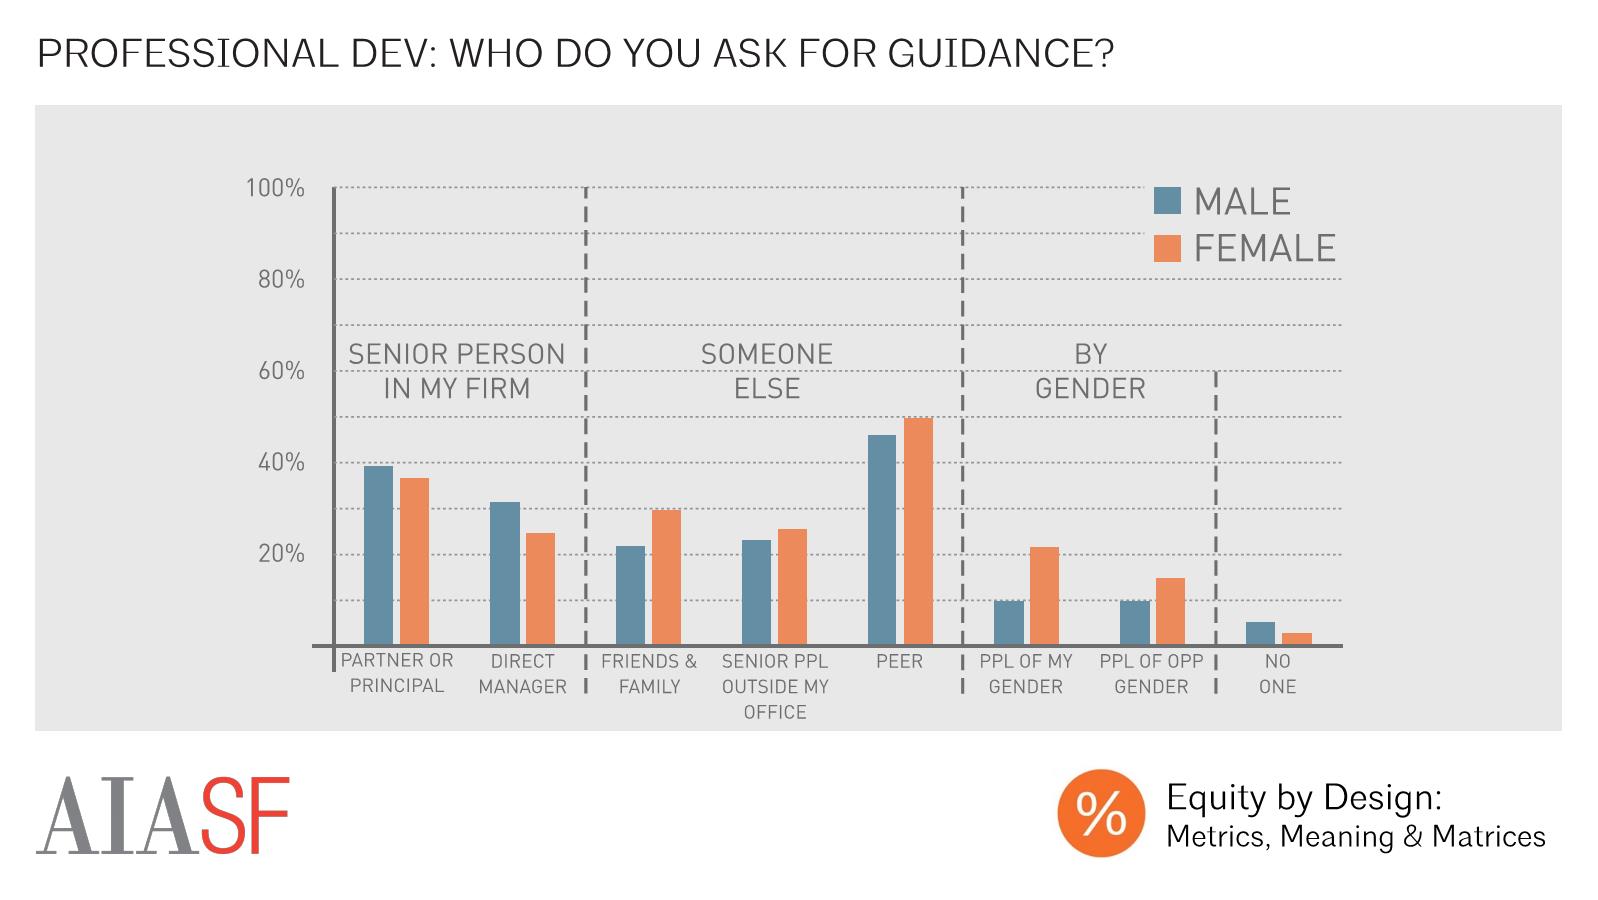
Mentorship and sponsorship -- and especially having access to career advice from a senior leader in one’s own firm -- emerged as important predictors of career success in the 2016 Equity in Architecture Survey. We found that male respondents were more likely than female respondents to report turning to someone senior within their own office for career guidance.. Meanwhile, female respondents were more likely than their male counterparts to turn to senior leaders outside of their offices, family & friends, and their peers for guidance. They were also more likely to consider gender as a factor when describing their mentors.
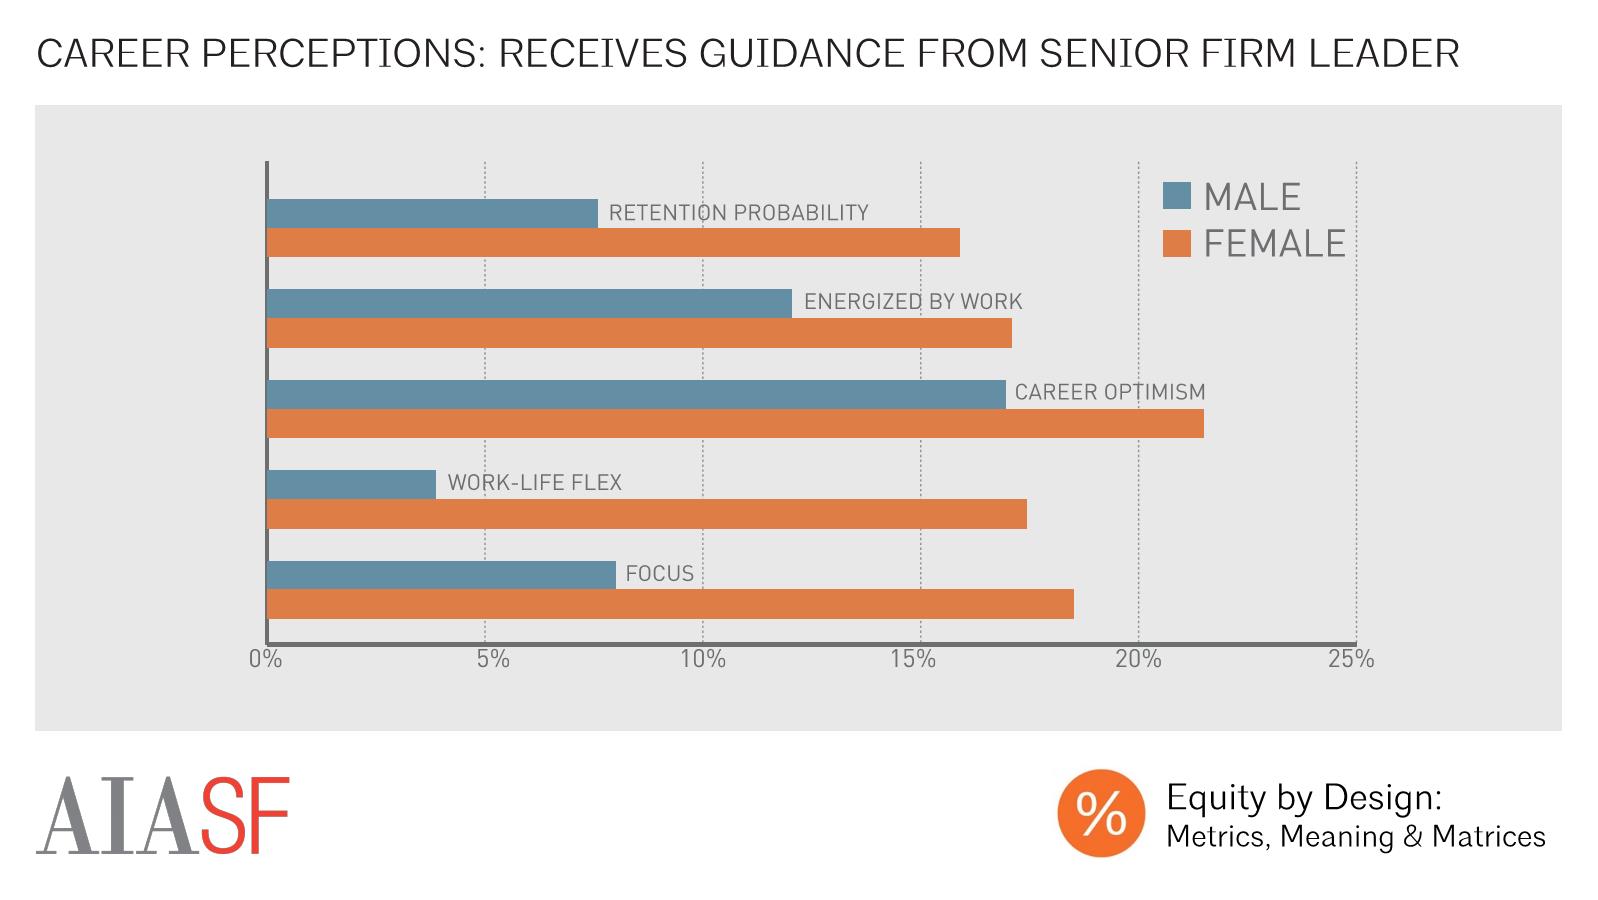
Male respondents’ increased likelihood of turning to senior leaders is especially significant because, compared to those who received no career guidance, those who turned to a senior leader within their firm were more more optimistic about their professional futures, more energized by their work, more likely to plan to stay at their current job. These correlations were stronger for female than for male respondents, suggesting that female respondents have more to gain by finding a senior mentor from their own firm.

While the difference in respondents’ average levels of experience accounts for some of the wage gap, significant differences in pay were observed between white male and other respondents even after controlling for years of experience. At every level of experience, male respondents made more, on average, than female respondents, with the largest differences amongst those with the most experience in the field.

There were also differences in annual earnings on the basis of race, with Black or African American practitioners with 14 or more years of experience earning less, on average, than White, Asian, Hispanic, or multiracial respondents. There were not significant differences in average annual earnings when comparing white and non-white respondents more generally.
White male respondents made more annually, on average, than white women or people of color. While white men made $96,514, on average, non-white women earned $69,550 on average. It’s important to note, however, that a large part of this difference in annual earnings can be attributed to discrepancies in the average experience level of demographic groups within the survey sample – while the average white male respondent had 18.5 years of experience, the average non-white female averaged 9.0 years, for instance.