One of the most important things to ask oneself when looking at the results of a survey is who is represented in the respondent pool, and how reflective that respondent pool is of the broader population being studied. The more representative the sample is, the stronger the evidence is that a survey’s results point to trends that occur in the population at large.
For the purposes of the Equity in Architecture survey, this means that we tried to garner a large number of responses, but more importantly, we worked to create a respondent pool that was as representative of the architectural community as possible. To do this, we worked with architecture schools, professional organizations, and firms across the country to send e-mail invitations directly to these groups’ entire mailing lists, thereby ensuring that survey invitations would go to those who are interested in equity issues, but also to potential survey-takers who haven’t considered equity to be a vital part of their practice. We are extremely grateful to AIA National, NCARB, NOMA, the ACSA, and the many schools of architecture, AIA components, and firms that sent invitations to take the 2016 Equity in Architecture Survey to their mailing lists. Our target survey population was graduates of architectural degree programs, including those who currently work in architectural practice, as well as those who are working in other fields, and those who are not currently doing paid work.
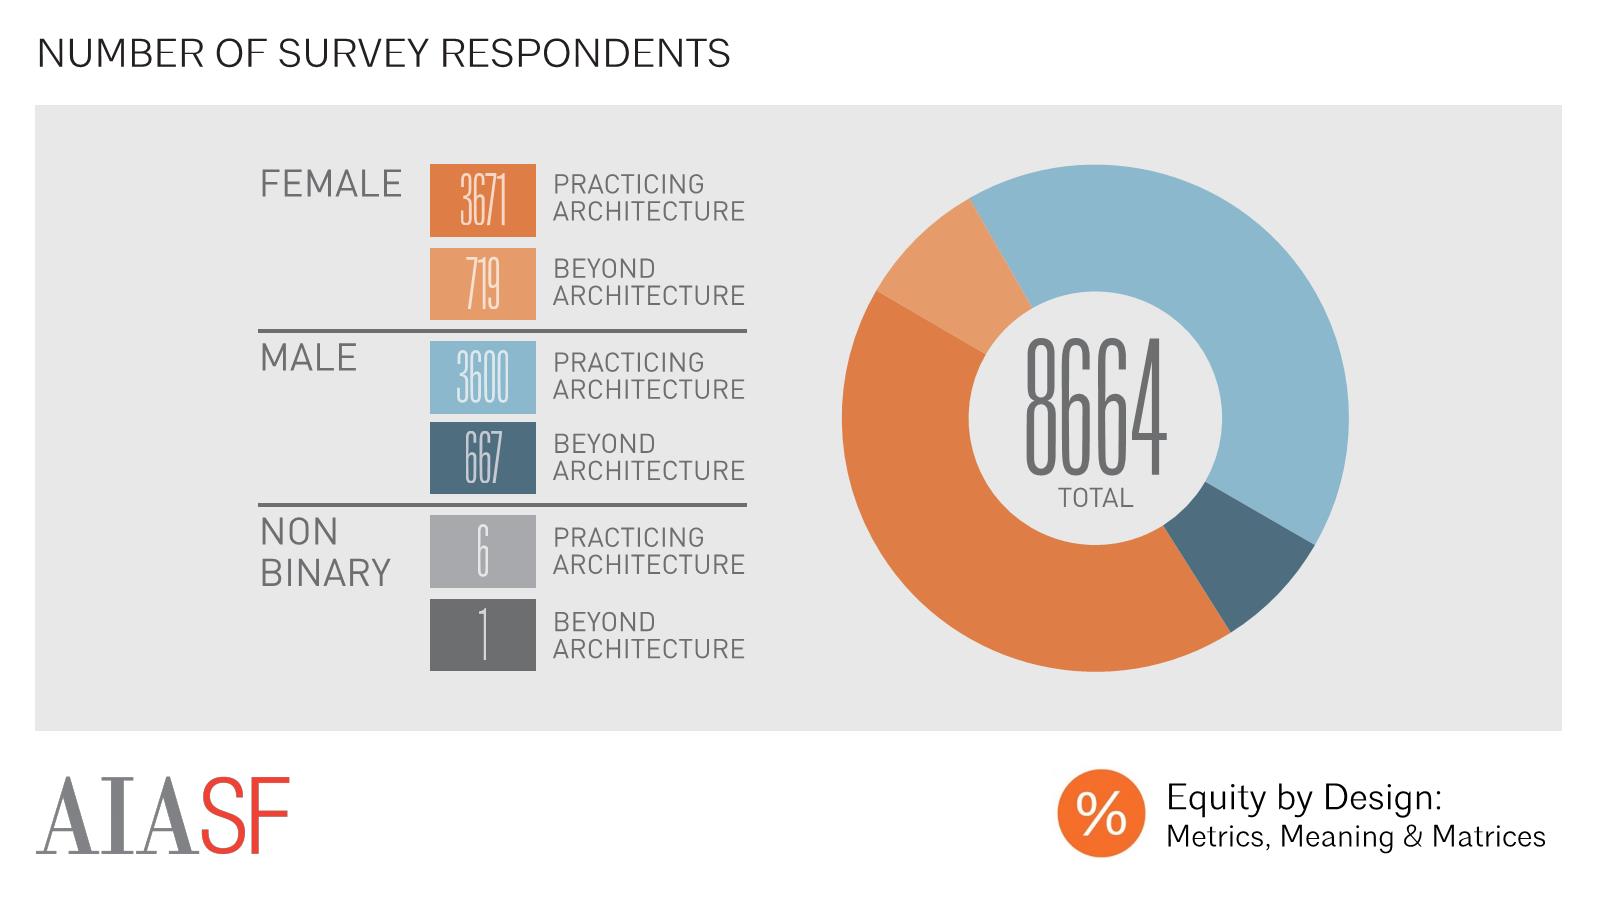
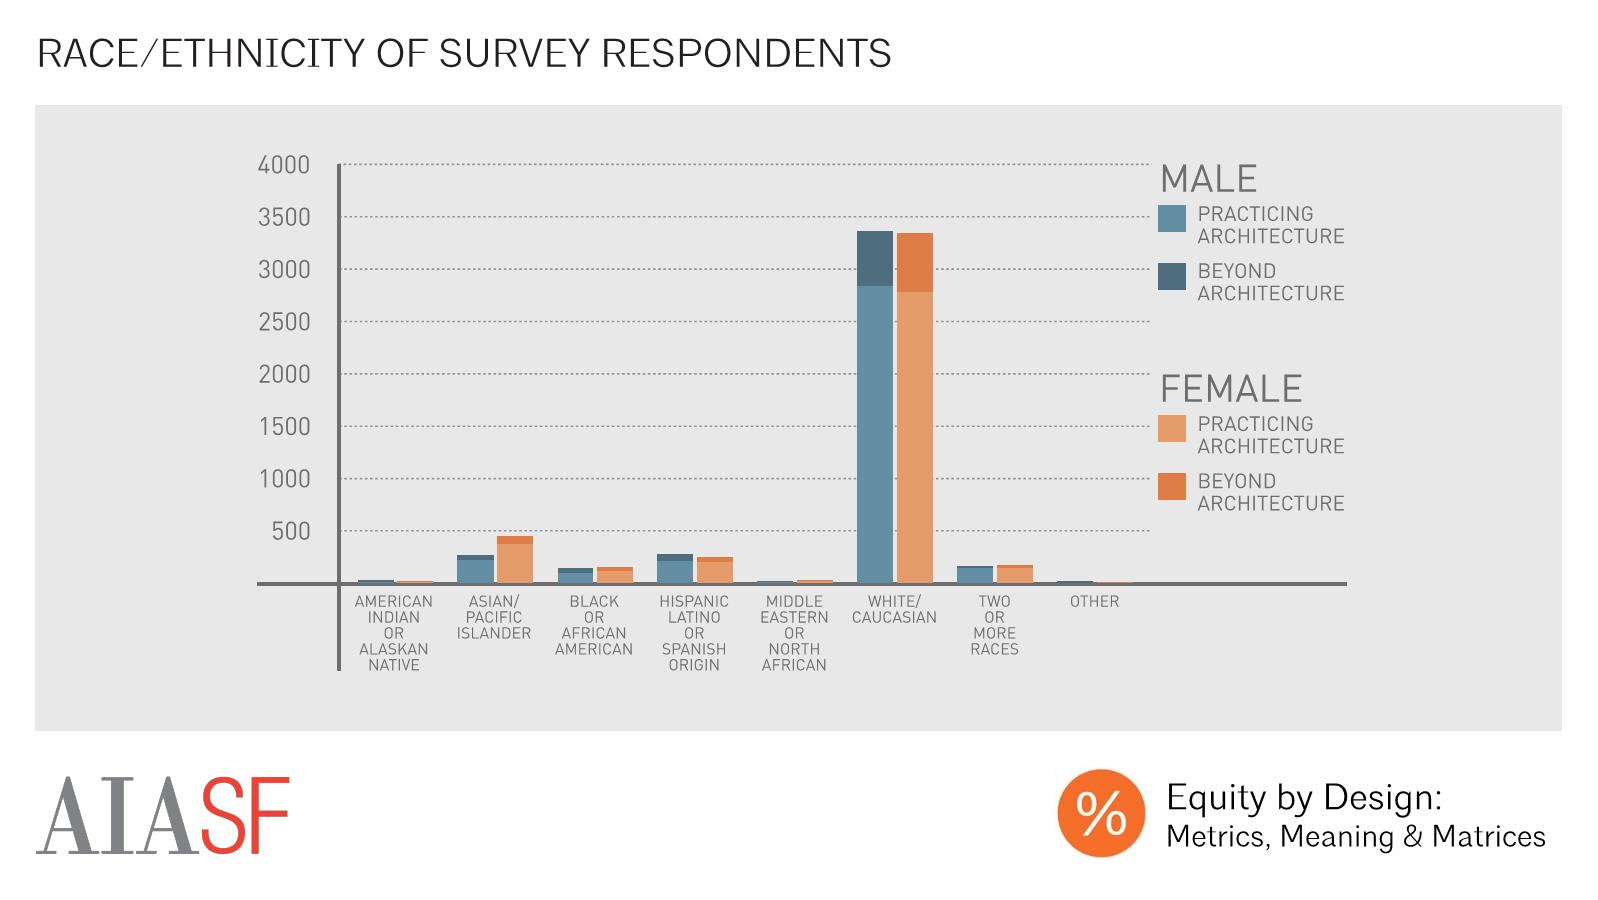
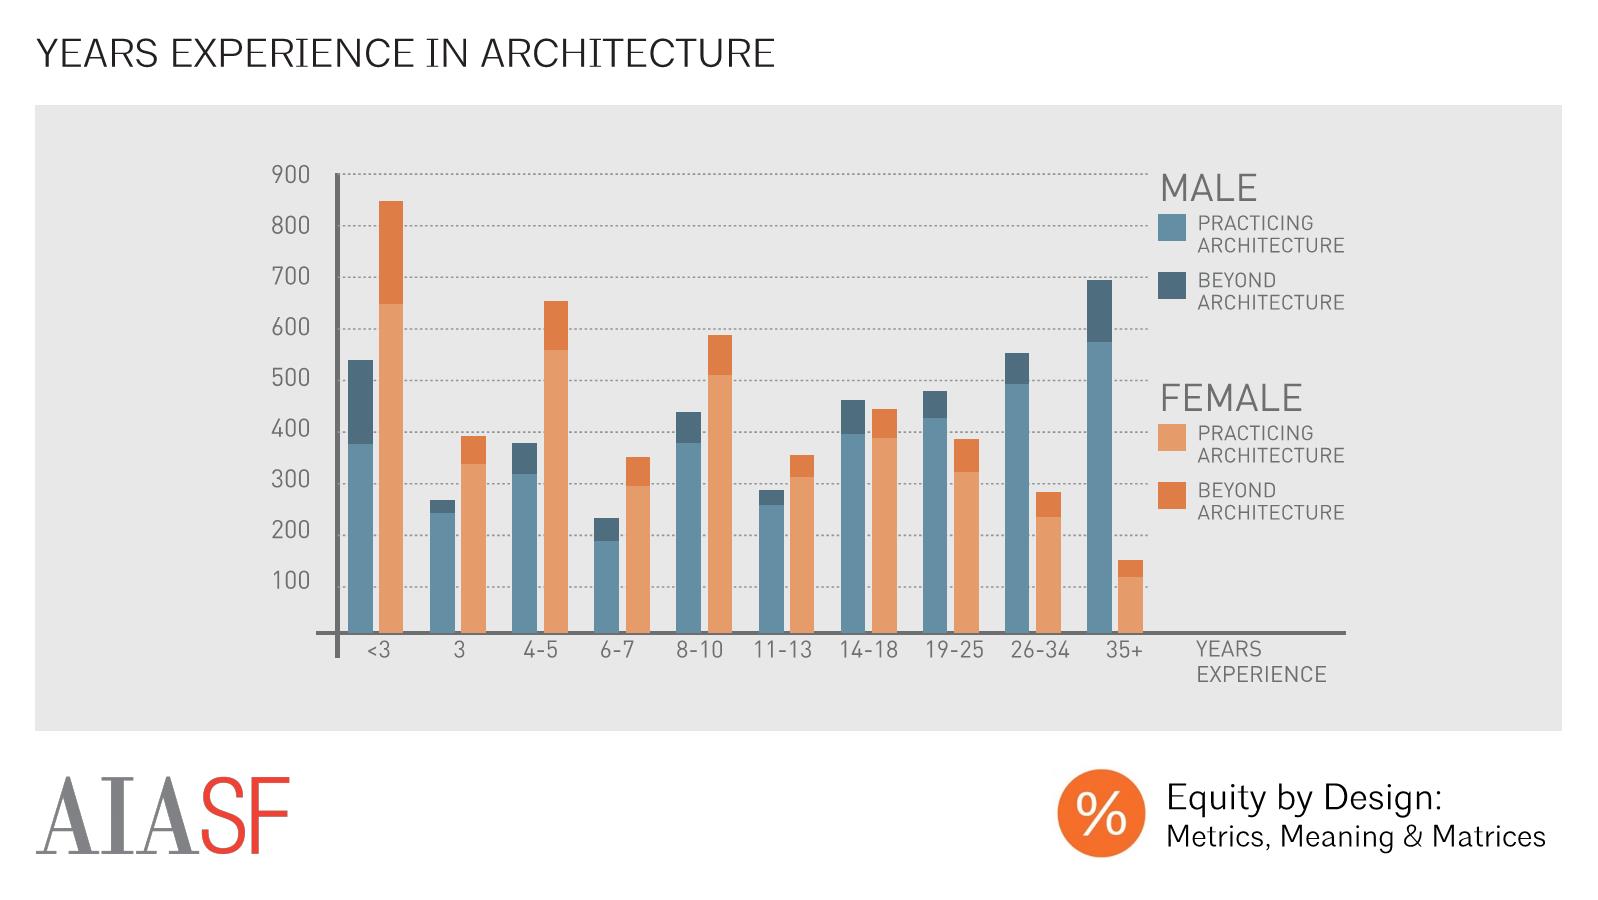
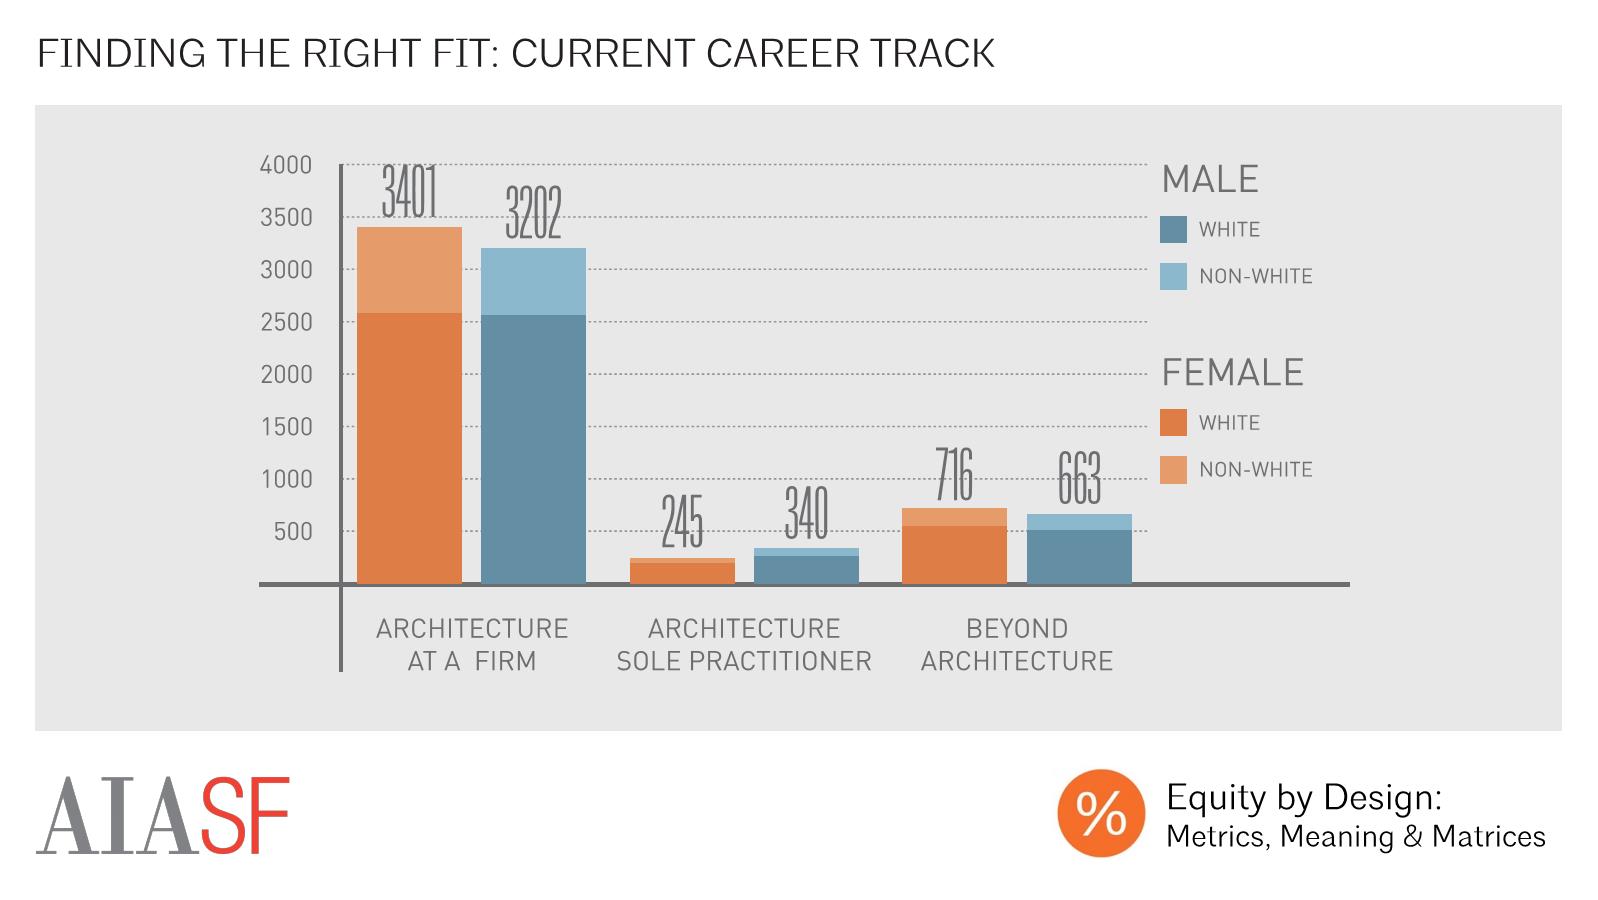
Overall, 8,664 respondents participated in the survey, making this the largest dataset ever conducted on the topic of equity in architecture in the U.S. While the survey population was the largest sample ever studied on this issue, it doesn’t mirror the demographics of the profession. Our sample was younger and more female than the architectural population as a whole. Moreover, our female respondent population was younger, on average, than our male respondent population. To correct for these variations in order to allow for meaningful analysis, we have shown our data broken out by race, gender and/or years of experience for each question in which significant differences in response occur on the basis of one of these factors.
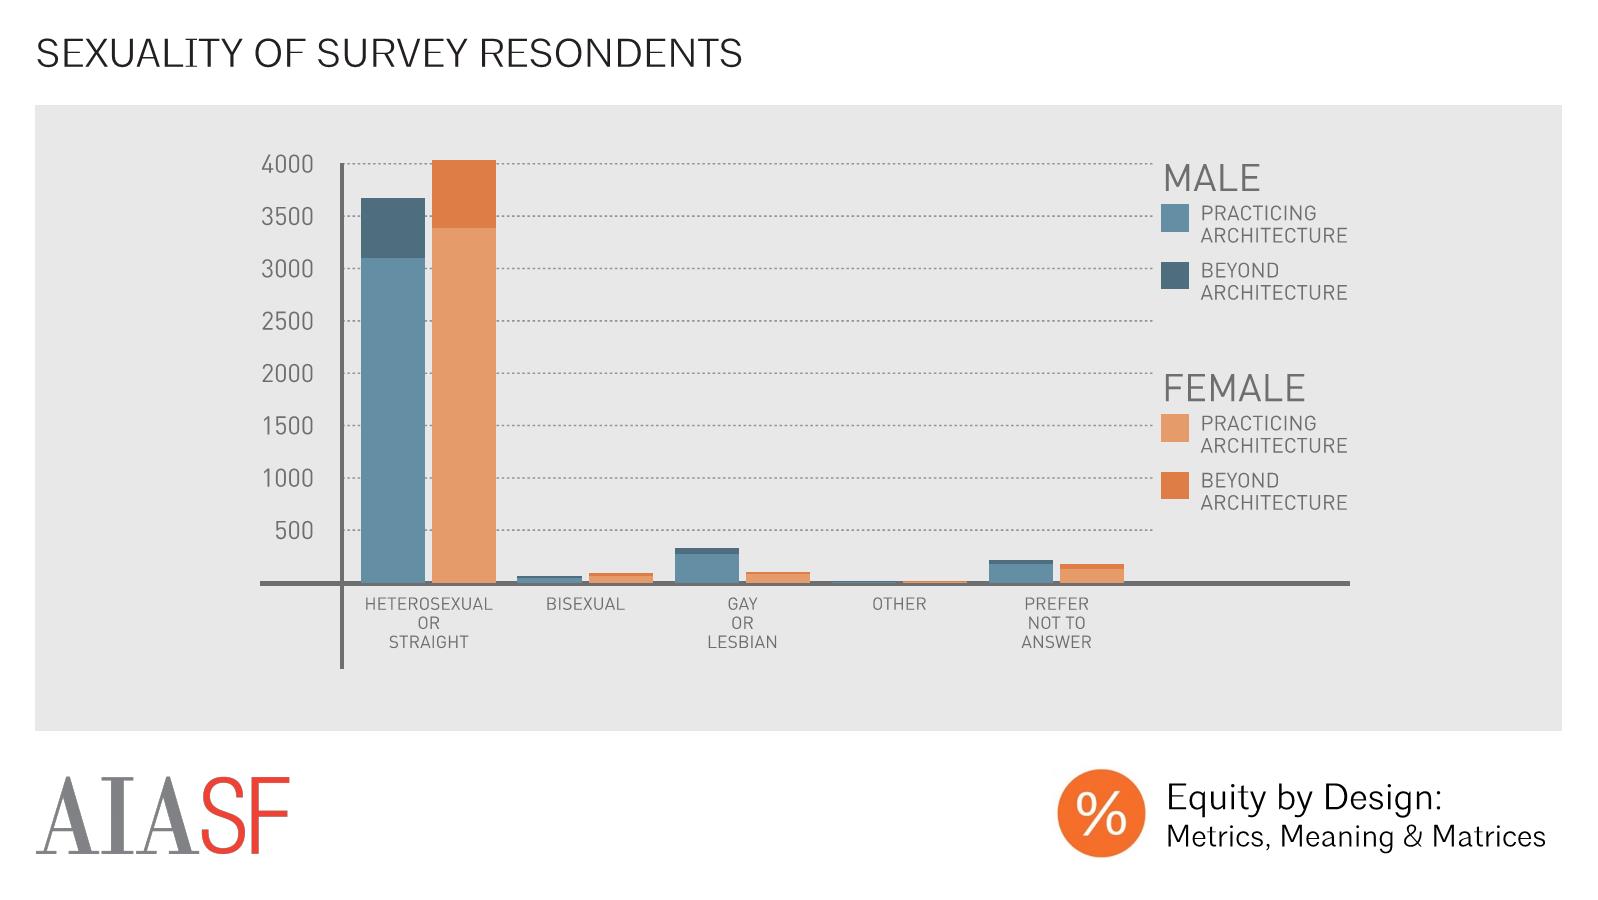
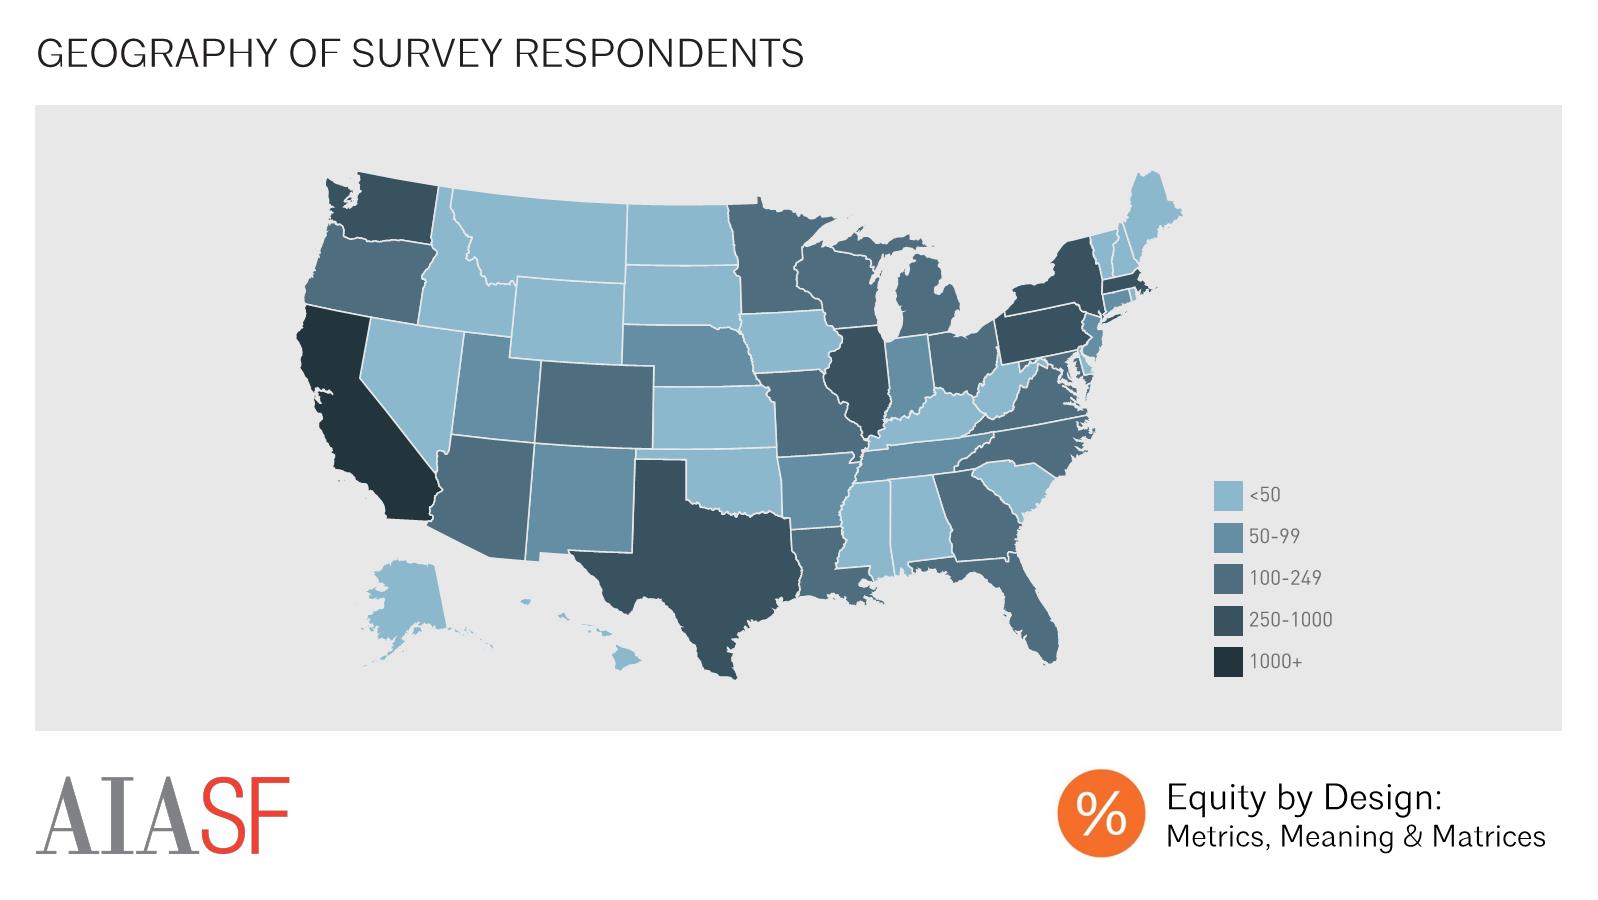
The following is a description of the demographics of our survey respondent pool, and is intended to help our readers understand and interpret the findings from the 2016 Equity in Architecture survey. Please scroll through each summary below by clicking the arrows at the top right corner of the infographics below. to get a better idea of our respondent identity: Gender, Race, Ethnicity, Sexuality, Geography, Years of Experience, Career Track. We’re looking forward to sharing an overview of of the latest, and best statistics on the demographics of the field as a whole within the next few weeks.
To view all the Demographic summaries - Please scroll through each summary below by clicking the arrows at the top right corner of the infographics

